RSS

Average is the new up! And above average could be the start of a new trend in Greater Vancouver real estate. Attached are the Sales and Listings Statistics updated to the end of October 2019. This October in the Greater Vancouver real estate market saw a significant increase in the amount of sales compared to October of last year. Buyers are clearly engaging; some home sellers are still reluctant to sell at today’s prices or are simply not engaging at all and the opportunities seen for buyers earlier in the year are diminishing. And with CMHC coming out recently and saying, “The Metro Vancouver Housing Market will see higher sales and modest price increases over the next two years. Resale activity and house prices are expected to fully recover from the recent decline.” The question of “When will we hit the bottom of the market” looks to have been answered with “we already have and are past that point.”

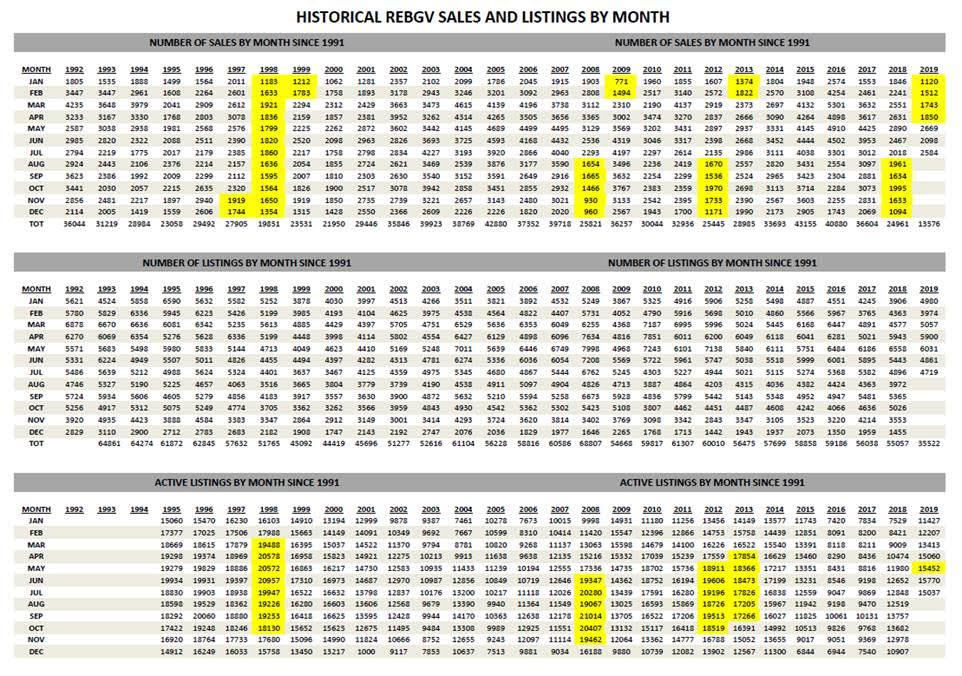
There were 2,892 homes sold of all types in Greater Vancouver in October this year compared with 2,363 homes sold last month, 1,995 sales in October last year and 3,073 homes sold in October 2017. October sales were 9 per cent above (yes that’s correct, above) the 10-year average for the month of October and actually 5 per cent above the 20-year average This was a 45 per cent increase in homes sold compared to October 2018, the same as September in comparison to the previous year. October sales were the highest monthly sales since October 2017. Activity noticeably accelerated towards the end of the month. Perhaps we should save the felines and not call this a “Dead Cat Bounce” but classify it as pent up demand actually coming forward and engaging in the market. It’s the fourth straight month of home sales being higher compared to the same month in the previous year after 17 straight months of those sales being lower compared to the previous year.

Some highlights from October:

  • Detached home sales again showed a significant year over year gain this month, up 45 per cent with townhomes up 55 per cent

  • Vancouver and North Vancouver showed stronger year over year sales for townhouses and condos in October

  • Sales of detached homes and townhouses in Richmond showed significant growth this month after being more stagnant in the previous two years, up 83 per cent and 80 per cent year over year respectively while condos were only 21 per cent higher compared to October 2018

  • Sales of townhouses and condos in Port Moody were 136 per cent and 78 per cent higher year over year this October with both showing months of supply at 2 months – indicators of a shift to seller’s market conditions

  • Coquitlam detached home sales were 115 per cent higher year over year in October

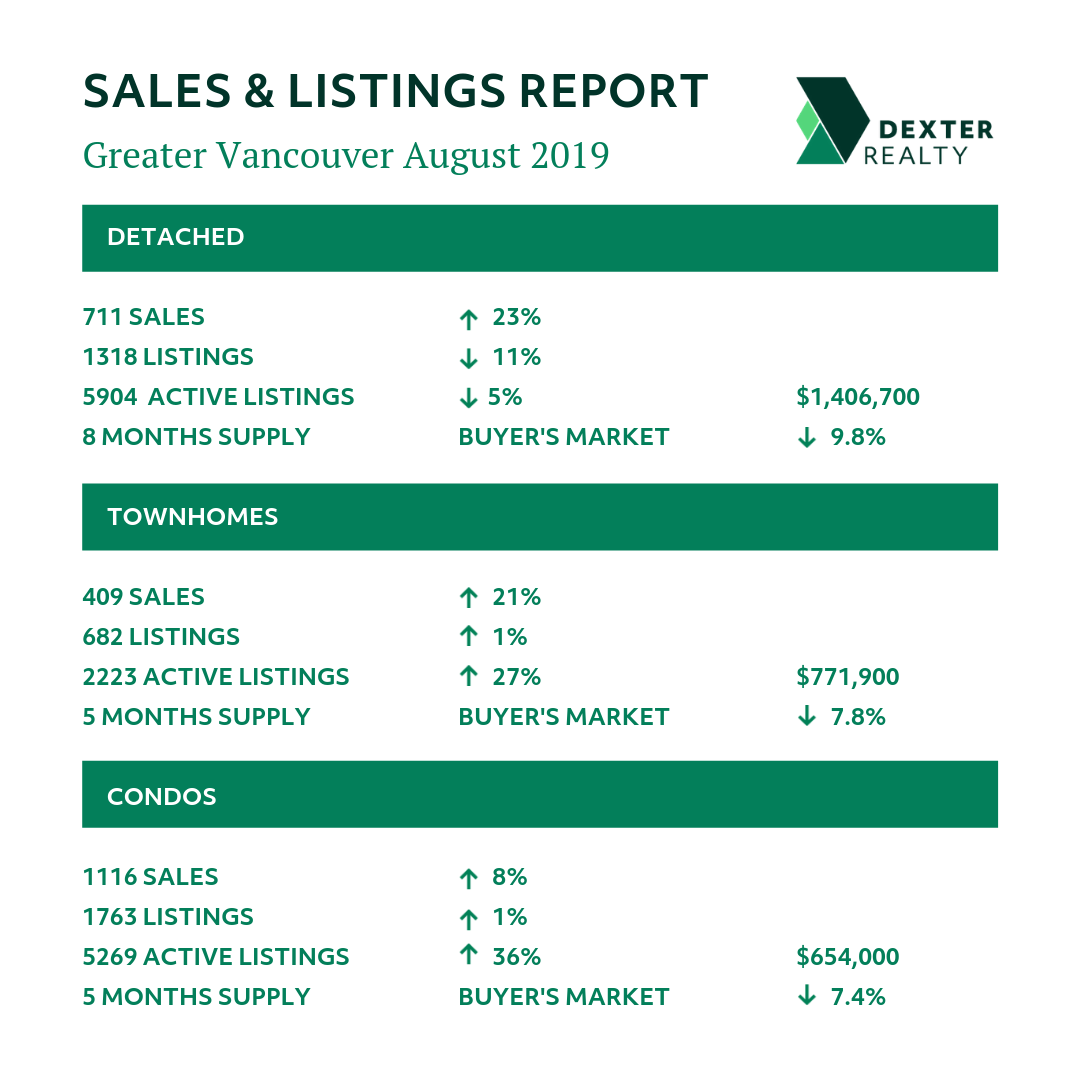
There were 943 detached houses sold in October 2019 up from 642 (46 per cent) in October 2018 in Greater Vancouver, with a 7.5 per cent decrease in the benchmark price of these homes year over year. For townhouses there were 536 sales in October 2019 compared to 344 in October 2018 (up 55 per cent) with a 5.8 per cent decrease in the benchmark price year over year; and for condos there were 1,384 sales in October 2019, an increase in sales from 985 in October 2018 (up 40 per cent) with a 5.9 per cent decrease in the benchmark price year over year. It would seem buyers are taking advantage of opportunities in the townhouse and detached home market as the gap in price between those and condos has come closer over the last two years.

The number of homes for sale in Greater Vancouver dropped significantly this month. At a time when government policies were supposed to be doing the opposite to resale home supply. At the end of September there were 14,242 homes for sale in Greater Vancouver, and at the end of October there were 13,022, the result was pushing some areas and product types into seller’s market conditions. Albeit without the overheated conditions experienced in 2015 and 2016. There were 4,183 new listings during October in Greater Vancouver, down 17 per cent from October last year and down 10 per cent from October 2017. The number of new listings in October 2019 were 5 per cent below the 10-year average for the month of October and 7 per cent below the 20-year average. While the number of detached homes listed for sale across the region has seen the biggest decrease, active listings for condos are now decreasing and more so in Vancouver, North Vancouver and Richmond.

So, did the federal election results in October provide any clarity on policies that may affect the housing market? With a minority Liberal government that has indicated it won’t align with any one party, policy will be that much more difficult to get through. And from the various election platforms, the policies were different amongst the Liberals, Conservatives and NDP parties. So, while it may have been easy to consider foreign buyers as the root cause of a lack of affordability, what we do know is that real estate transactions in Metro Vancouver are very local currently. When the activity increased in May, the percentage of foreign buyers significantly dropped and continued at this lower level through the next 4 months according to numbers released by the provincial government. May through August showed the percentage of transactions attributed to foreign buyers at less than 1.7 per cent with the average for 2019 currently at 2.3 per cent. Given the various policies implemented by government are not producing more supply, and are more so restricting supply where will the blame go if sales activity and prices edge up in the next two years?

“Home buyers have more confidence today than we saw in the first half of the year,” Ashely Smith, Real Estate Board of Greater Vancouver president said. “With prices edging down over the last year and interest rates remaining low, hopeful home buyers are becoming more active this fall. The recent uptick in home sales is moving us into a more historically typical market, both sale and listing activity is trending around our long-term averages in recent months.”

East of the Fraser River, the Fraser Valley Real Estate Board processed 1,592 sales of all property types on its Multiple Listing Service® in October, an increase of 18.5 per cent compared to sales in September and a 37.8 per cent increase compared to the 1,155 sales in October of last year. Active listings for the Fraser Valley finished at 7,398, decreasing 6.9 per cent month-over-month and a decrease of 4.5 per cent when compared to October 2018. There were 2,383 new listings in October, a 14.2 per cent decrease compared to October 2018 and a 13.9 per cent decrease compared to September 2019. “Our market started to pick up in the summer and we’ve been steadily improving since. It’s rare to see October homes sales in the Fraser Valley outpace April and that’s what we’ve seen this year; our typical spring and fall markets have flipped.” said Darin Germyn, President of the Fraser Valley Real Estate Board. “Consumers are feeling more confident. Buyers have grown accustomed to the government’s regulation changes. Interest rates have thankfully remained stable and we’re likely seeing some pent-up demand from buyers who were holding off earlier this year. October’s beautiful, sunny weather didn’t hurt either.”

Here’s a summary of the numbers:

Greater Vancouver: Total Units Sold in October 2019 was 2,892 – up from 2,363 (22%) in September 2019, up from 1,634 (45%) in October 2018, down from 3,073 (6%) in October 2017; Active Listings are at 13,022 compared to 13,682 (down 5%) at this time last year; New Listings in October 2019 were down 17% compared to October 2018 and down 10% compared to October 2017; Month’s Supply of Total Residential Listings is down to 5 Month’s Supply (Balanced to Buyer’s Market conditions with signs of Seller’s Market conditions in some areas and product types) and a Sales to Listings Ratio of 69% compared to 40% in October 2018 and 47% in September 2019.

Vancouver Westside Residential: Total Units Sold in October 2019 was 506 – up from 404 (25%) in September 2019, up from 381 (33%) in October 2018, down from 556 (9%) in October 2017; Active Listings are at 2,278 compared to 2,459 (down 7%) at this time last year; New Listings in October 2019 were down 19% compared to October 2018 and down 12% compared to October 2017; Month’s Supply of Total Residential Listings is down to 5 Month’s Supply (Balanced to Buyer’s Market conditions with signs of Seller’s Market conditions in lower price ranges) and a Sales to Listings Ratio of 62% compared to 37% in October 2018 and 41% in September 2019.

Vancouver East Side Residential: Total Units Sold in October 2019 was 316 – up from 293 (8%) in September 2019, up from 234 (35%) in October 2018, up from 298 (6%) in October 2017; Active Listings are at 1,183 compared to 1,409 (down 16%) at this time last year; New Listings in October 2019 were down 17% compared to October 2018 and down 21% compared to October 2017; Month’s Supply of Total Residential Listings is steady at 4 Month’s Supply (Balanced to Seller’s Market conditions) and a Sales to Listings Ratio of 72% compared to 44% in October 2018 and 51% in September 2019.

North Vancouver Residential: Total Units Sold in October 2019 was 260 – up from 166 (57%) in September 2019, up from 173 (50%) in October 2018, up from 250 (4%) in October 2017; Active Listings are at 777 compared to 938 (down 17%) at this time last year; New Listings in October 2019 were down 27% compared to October 2018 and down 16% compared to October 2017; Month’s Supply of Total Residential Listings is down to 3 Month’s Supply (Balanced to Seller’s Market conditions) and a Sales to Listings Ratio of 76% compared to 37% in October 2018 and 37% in September 2019.

West Vancouver Houses: Total Units Sold in October 2019 was 66 – up from 51 (29%) in September 2019, up from 55 (20%) in October 2018, up from 46 (43%) in October 2017; Active Listings are at 678 compared to 743 (down 9%) at this time last year; New Listings in October 2019 were down 24% compared to October 2018 and down 19% compared to October 2017; Month’s Supply of Total Residential Listings is down to 10 Month’s Supply (Buyer’s Market) and a Sales to Listings Ratio of 42% compared to 26% in October 2018 and 22% in September 2019.

Richmond Residential: Total Units Sold in October 2019 was 345 – up from 283 (22%) in September 2019, up from 230 (45%) in October 2018, down from 411 (16%) in October 2017; Active Listings are at 1,948 compared to 1,878 (down 4%) at this time last year; New Listings in October 2019 were down 13% compared to October 2018 and down 18% compared to October 2017; Month’s Supply of Total Residential Listings is down to 6 Month’s Supply (Balanced to Buyer’s Market conditions) and a Sales to Listings Ratio of 68% compared to 39% in October 2018 and 51% in September 2019.

Burnaby East: Total Units Sold in October 2019 was 26 – up from 22 (18%) in September 2019, up from 17 (53%) in October 2018, up from 22 (18%) in October 2017; Active Listings are at 153 compared to 148 (up 3%) at this time last year; New Listings in October 2019 were the same as October 2018 and down 13% compared to October 2017; Month’s Supply of Total Residential Listings is down to 6 Month’s Supply (Balanced to Buyer’s Market conditions) and a Sales to Listings Ratio of 50% compared to 33% in October 2018 and 39% in September 2019.

Burnaby North: Total Units Sold in October 2019 was 166 – up from 138 (20%) in September 2019, up from 76 (118%) in October 2018, up from 161 (3%) in October 2017; Active Listings are at 517 compared to 556 (down 7%) at this time last year; New Listings in October 2019 were down 17% compared to October 2018 and up 6% compared to October 2017; Month’s Supply of Total Residential Listings is down to 3 Month’s Supply (Balanced to Seller’s Market conditions in some areas and product types) and a Sales to Listings Ratio of 80% compared to 30% in October 2018 and 55% in September 2019.

Burnaby South: Total Units Sold in October 2019 was 157 – up from 119 (32%) in September 2019, up from 87 (80%) in October 2018, down from 184 (15%) in October 2017; Active Listings are at 704 compared to 693 (up 2%) at this time last year; New Listings in October 2019 were down 18% compared to October 2018 and up 3% compared to October 2017; Month’s Supply of Total Residential Listings is down to 4 Month’s Supply (Balanced to Seller’s Market conditions in some areas and product types) and a Sales to Listings Ratio of 68% compared to 31% in October 2018 and 51% in September 2019.

New Westminster: Total Units Sold in October 2019 was 136 – up from 110 (24%) in September 2019, up from 88 (55%) in October 2018, down from 152 (11%) in October 2017; Active Listings are at 430 compared to 511 (down 16%) at this time last year; New Listings in October 2019 were down 34% compared to October 2018 and down 19% compared to October 2017; Month’s Supply of Total Residential Listings is down to 3 Month’s Supply (Balanced to Buyer’s Market conditions with signs of Seller’s Market conditions) and a Sales to Listings Ratio of 85% compared to 36% in October 2018 and 51% in September 2019.

Coquitlam: Total Units Sold in October 2019 was 254 – up from 213 (19%) in September 2019, up from 136 (87%) in October 2018, up from 248 (2%) in October 2017; Active Listings are at 882 compared to 1,026 (down 14%) at this time last year; New Listings in October 2019 were down 11% compared to October 2018 and down 2% compared to October 2017; Month’s Supply of Total Residential Listings is down to 3 Month’s Supply (Balanced to Seller’s Market conditions in some areas and product types) and a Sales to Listings Ratio of 77% compared to 37% in October 2018 and 56% in September 2019.

Port Moody: Total Units Sold in October 2019 was 66 – up from 49 (53%) in September 2019, up from 36 (83%) in October 2018, down from 76 (13%) in October 2017; Active Listings are at 204 compared to 242 (down 16%) at this time last year; New Listings in October 2019 were up 15% compared to October 2018 and down 19% compared to October 2017; Month’s Supply of Total Residential Listings is down to 3 Month’s Supply (Balanced to Seller’s Market conditions in some areas and product types) and a Sales to Listings Ratio of 80% compared to 51% in October 2018 and 52% in September 2019.

Port Coquitlam: Total Units Sold in October 2019 was 107 – up from 78 (37%) in September 2019, up from 75 (43%) in October 2018, down from 120 (11%) in October 2017; Active Listings are at 296 compared to 357 (down 17%) at this time last year; New Listings in October 2019 were down 21% compared to October 2018 and down 3% compared to October 2017; Month’s Supply of Total Residential Listings is down to 3 Month’s Supply (Balanced to Seller’s Market conditions in some areas and product types) and a Sales to Listings Ratio of 84% compared to 46% in October 2018 and 54% in September 2019.

Ladner: Total Units Sold in October 2019 was 34 – up from 28 (21%) in September 2019, up from 22 (55%) in October 2018, up from 31 (10%) in October 2017; Active Listings are at 180 compared to 177 (up 2%) at this time last year; New Listings in October 2019 were up 16% compared to October 2018 and up 27% compared to October 2017; Month’s Supply of Total Residential Listings is down to 5 Month’s Supply (Balanced to Buyer’s Market conditions in some areas and product types) and a Sales to Listings Ratio of 52% compared to 50% in October 2018 and 51% in September 2019.

Tsawwassen: Total Units Sold in October 2019 was 32 – up from 26 (23%) in September 2019, up from 25 (25%) in October 2018, down from 40 (20%) in October 2017; Active Listings are at 296 compared to 230 (down 29%) at this time last year; New Listings in October 2019 were up 19% compared to October 2018 and up 27% compared to October 2017; Month’s Supply of Total Residential Listings is down to 9 Month’s Supply (Buyer’s Market) and a Sales to Listings Ratio of 40% compared to 37% in October 2018 and 33% in September 2019.

Pitt Meadows: Total Units Sold in October 2019 was 31 – down from 32 (4%) in September 2019, the same as October 2018, down from 35 (11%) in October 2017; Active Listings are at 104 compared to 115 (down 9%) at this time last year; New Listings in October 2019 were up 33% compared to October 2018 and up 11% compared to October 2017; Month’s Supply of Total Residential Listings is steady at 3 Month’s Supply (Balanced to Seller’s Market conditions in some areas and product types) and a Sales to Listings Ratio of 64% compared to 86% in October 2018 and 54% in September 2019.

Maple Ridge: Total Units Sold in October 2019 was 180 – up from 145 (24%) in September 2019, down from 183 (2%) in October 2018, the same as October 2017; Active Listings are at 765 compared to 703 (up 8%) at this time last year; New Listings in October 2019 were down 17% compared to October 2018 and down 18% compared to October 2017; Month’s Supply of Total Residential Listings is down to 4 Month’s Supply (Balanced to Seller’s Market conditions in some areas and product types) and a Sales to Listings Ratio of 74% compared to 49% in October 2018 and 55% in September 2019.


Kevin Skipworth
Managing Broker/Partner


Read

Market Momentum Continues into the Fall - Oct. 15, 2019
Vancouver, BC – October 15, 2019. The British Columbia Real Estate Association (BCREA) reports that a total of 6,938 residential unit sales were recorded by the Multiple Listing Service® (MLS®) in September, an increase of 24 per cent from the same month last year. The average MLS® residential price in the province was $697,943, an increase of 2.1 per cent from September 2018. Total sales dollar volume was $4.84 billion, a 26.5 per cent increase from the same month last year.

“Markets across BC built on momentum from the summer,” said BCREA Chief Economist Brendon Ogmundson. “While the year-over-year increase in provincial sales was quite strong, home sales in most areas are simply returning to historically average levels.”

MLS® residential active listings in the province were up 4 per cent from September 2018 to 39,117 units and were essentially flat compared to August on a seasonally adjusted basis. Overall market conditions remained in a balanced range with a sales-to-active listings ratio of about 18 per cent.    
 
Year-to-date, BC residential sales dollar volume was down 12.4 per cent to $39.7 billion, compared with the same period in 2018. Residential unit sales were 8.9 per cent lower at 57,773 units, while the average MLS® residential price was down 3.9 per cent year-to-date at $687,530.    
 
-30-
For more information, please contact:  

Brendon Ogmundson
Chief Economist
Direct: 604.742.2796
Mobile: 604.505.6793
Email: bogmundson@bcrea.bc.ca
Read

Greater Vancouver Sales and Listings Report for September 2019

Attached are the Sales and Listings Stats updated to the end of September 2019. Back to school, back to selling. The number of sales in September were up from August, a rare occurrence going from August to September. And yes, the number of new listings were down, pulling Active Listings down with it. So where is the autumn market going? Well let’s find out by seeing where the summer left off.

There were 2,363 homes sold of all types in Greater Vancouver in September this year compared with 2,256 homes sold last month, 1,634 sales in September last year and 2,881 homes sold in September 2017. September sales were 7 per cent below the 10-year average for the month of September and marked a 45 per cent increase over September 2018. This was the largest year over year increase in sales in over 2 years and the third straight month that a year over year increase in sales has occurred. Buyers are engaging with offers, and the occurrence of multiple offers continues to be present in the market – even more so than we’ve seen in the last 3 months. While they tend to be happening more in the apartment and townhouse segment of the market, there was a detached listing on the Westside of Vancouver priced in the $3 Million range that attracted 12 offers. Showing that well priced properties will sell. There were 753 detached houses sold in September 2019 up from 509 (47 per cent) in September 2018 in Greater Vancouver, with a 8.6 per cent decrease in the benchmark price of these homes year over year. For townhouses there were 422 sales in September 2019 compared to 275 in September 2018 (up 53 per cent) with a 7.2 per cent decrease in the benchmark price year over year; and for condos there were 1,155 sales in September 2019, an increase in sales from 812 in September 2018 (up 43 per cent) with an 6.5 per cent decrease in the benchmark price year over year. In Greater Vancouver detached homes make up 32 per cent of all home sales, while apartments make up 50 per cent. If we move over to the Westside of Vancouver, detached homes make up only 15 per cent of sales, while apartments make up 75 per cent.

As for the supply homes in Greater Vancouver, there was a decrease in the number of new listings in September compared to September of last year. There were 4,989 new listings during September in Greater Vancouver, down 7 per cent from September last year and down 9 per cent from September 2017. The number of new listings in September 2019 were 6 per cent below the 10-year average for the month of September. Active Listings are at 14,242 at month end (up 3.5 per cent compared to September 2018). The number of homes on the market is shrinking as is the gap year-over-year. There continues to be a reluctance for sellers to engage in the current market, leaving fewer and fewer choices for buyers. Government policy aimed at creating affordability has not led to a significant increase in housing options but instead has left buyers continuing to fight over what comes on the market. With buyers adjusting to the Mortgage Stress Test enacted in January 2017 for conventional mortgages, those wanting to engage don’t have the options one would think in a quiet real estate market.

So where will the fall go? Well we have a federal election coming this month. Housing affordability is a main topic of several of the federal party’s platforms – all seemingly under the guise of taxing demand. While it’s recognized that supply needs to be brought forward, there is no clear plan to provide that. But what we do know is that buyers continue to be dealing with an undersupplied housing market in Metro Vancouver. Foreign buyers have been taxed for 3 years now, Speculation and Vacancy Taxes have been in place for a year or more in the case of the City of Vancouver, but to what end? Local buyers’ purchasing power was reduced with the mortgage rule changes, and now that prices have adjusted to reflect that and buyer’s have adjusted their budgets, but the government is still looking at one side of the equation and looking to supress demand – mostly local demand which will only lead to a continued build up of buyers and sellers wanting to transact. Where is the challenge to look at the supply side of the equation?

“We’re seeing more balanced housing market conditions over the last three months compared to what we saw at this time last year,” Ashely Smith, Real Estate Board of Greater Vancouver president said. “Home buyers are more willing to make offers today, particularly in the townhome and apartment markets.”

East of the Fraser River, the Fraser Valley Real Estate Board processed 1,343 sales of all property types on its Multiple Listing Service® in September, a increase of 3.5 per cent compared to sales in August and a 29.8 per cent increase compared to the 1,035 sales in September of last year. Active listings for the Fraser Valley finished at 7,946, decreasing 1.2 per cent month-over-month and an increase of 3.9 per cent when compared to September 2018. There were 2,769 new listings in September, an 6 per cent decrease compared to September 2018. “The market’s return to balance is good news for both buyers and sellers, however it’s important to put the 30 per cent year-over-year increase in sales into context. September’s sales went from amongst the worth in 10 years to just above our 10-year average.” said Darin Germyn, President of the Fraser Valley Real Estate Board. “Home prices are still dropping compared to a year ago, but on a month-to-month basis, prices are moderating because supply is shrinking. Our incoming supply of new listings has dropped consistently for the last four months pushing our total inventory in the Fraser Valley to the lowest it’s been since April, which has had an impact on prices”

Here’s a summary of the numbers:

Greater Vancouver: Total Units Sold in September 2019 was 2,363 – up from 2,256 (5%) in August 2019, up from 1,634 (45%) in September 2018, down from 2,881 (18%) in September 2017; Active Listings are at 14,242 compared to 13,760 (up 4%) at this time last year; New Listings in September 2019 were down 7% compared to September 2018 and down 9% compared to September 2017; Month’s Supply of Total Residential Listings is steady at 6 Month’s Supply (Balanced to Buyer’s Market conditions in some areas and product types and price range) and a Sales to Listings Ratio of 47% compared to 30% in September 2018 and 59% in August 2019.

Vancouver Westside Residential: Total Units Sold in September 2019 was 404 – down from 423 (4%) in August 2019, up from 280 (44%) in September 2018, down from 540 (25%) in September 2017; Active Listings are at 2,444 compared to 2,433(down 0.5%) at this time last year; New Listings in September 2019 were down 4% compared to September 2018 and down 6% compared to September 2017; Month’s Supply of Total Residential Listings is up to 6 Month’s Supply (Balanced to Buyer’s Market conditions in some areas and product types and price range) and a Sales to Listings Ratio of 41% compared to 27% in September 2018 and 67% in August 2019.

Vancouver Eastside Residential: Total Units Sold in September 2019 was 293 – up from 235 (25%) in August 2019, up from 195 (50%) in September 2018, up from 268 (9%) in September 2017; Active Listings are at 1,295 compared to 1,494 (down 13%) at this time last year; New Listings in September 2019 were down 5% compared to September 2018 and up 2% compared to September 2017; Month’s Supply of Total Residential Listings is down to 4 Month’s Supply (Balanced Market) and a Sales to Listings Ratio of 51% compared to 32% in September 2018 and 65% in August 2019.

North Vancouver Residential: Total Units Sold in September 2019 was 166 – down from 184 (10%) in August 2019, up from 120 (38%) in September 2018, down from 210 (20%) in September 2017; Active Listings are at 895 compared to 933 (down 4%) at this time last year; New Listings in September 2019 were down 18% compared to September 2018 and down 5% compared to September 2017; Month’s Supply of Total Residential Listings is steady at 5 Month’s Supply (Balanced to Buyer’s Market conditions in some areas and product types and price range) and a Sales to Listings Ratio of 37% compared to 22% in September 2018 and 70% in August 2019.

West Vancouver Houses: Total Units Sold in September 2019 was 51 – up from 49 (4%) in August 2019, up from 34 (50%) in September 2018, down from 56 (9%) in September 2017; Active Listings are at 721 compared to 764 (down 6%) at this time last year; New Listings in September 2019 were down 5% compared to September 2018 and down 19% compared to September 2017; Month’s Supply of Total Residential Listings is steady at 14 Month’s Supply (Buyer’s Market) and a Sales to Listings Ratio of 22% compared to 14% in September 2018 and 36% in August 2019.

Richmond Residential: Total Units Sold in September 2019 was 283 – up from 250 (13%) in August 2019, up from 196 (44%) in September 2018, down from 379 (25%) in September 2017; Active Listings are at 2,127 compared to 1,915 (up 11%) at this time last year; New Listings in September 2019 were down 14% compared to September 2018 and down 22% compared to September 2017; Month’s Supply of Total Residential Listings is down to 8 Month’s Supply (Buyer’s Market) and a Sales to Listings Ratio of 51% compared to 30% in September 2018 and 48% in August 2019.

Burnaby East: Total Units Sold in September 2019 was 22 – down from 31 (29%) in August 2019, up from 11 (100%) in September 2018, down from 28 (21%) in September 2017; Active Listings are at 159 compared to 140 (up 14%) at this time last year; New Listings in September 2019 were up 8% compared to September 2018 and down 8% compared to September 2017; Month’s Supply of Total Residential Listings is up to 7 Month’s Supply (Balanced to Buyer’s Market conditions in some areas and product types and price range) and a Sales to Listings Ratio of 39% compared to 21% in September 2018 and 58% in August 2019.

Burnaby North: Total Units Sold in September 2019 was 138 – up from 129 (7%) in August 2019, up from 83 (66%) in September 2018, up from 129 (7%) in September 2017; Active Listings are at 577 compared to 533 (up 8%) at this time last year; New Listings in September 2019 were up 2% compared to September 2018 and down 6% compared to September 2017; Month’s Supply of Total Residential Listings is down to 4 Month’s Supply (Balanced Market) and a Sales to Listings Ratio of 55% compared to 34% in September 2018 and 61% in August 2019.

Burnaby South: Total Units Sold in September 2019 was 119 – down from 126 (6%) in August 2019, up from 82 (45%) in September 2018, down from 164 (27%) in September 2017; Active Listings are at 777 compared to 656 (up 18%) at this time last year; New Listings in September 2019 were down 4% compared to September 2018 and down 24% compared to September 2017; Month’s Supply of Total Residential Listings is up to 7 Month’s Supply (Balanced to Buyer’s Market conditions in some areas and product types and price range) and a Sales to Listings Ratio of 51% compared to 34% in September 2018 and 51% in August 2019.

New Westminster: Total Units Sold in September 2019 was 110 – up from 97 (13%) in August 2019, up from 81 (36%) in September 2018, down from 155 (29%) in September 2017; Active Listings are at 502 compared to 460 (up 9%) at this time last year; New Listings in September 2019 were down 11% compared to September 2018 and down 16% compared to September 2017; Month’s Supply of Total Residential Listings is steady at 5 Month’s Supply (Balanced to Buyer’s Market conditions in some areas and product types and price range) and a Sales to Listings Ratio of 51% compared to 33% in September 2018 and 58% in August 2019.

Coquitlam: Total Units Sold in September 2019 was 213 – up from 198 (8%) in August 2019, up from 131 (63%) in September 2018, down from 230 (7%) in September 2017; Active Listings are at 998 compared to 1,056 (down 5%) at this time last year; New Listings in September 2019 were down 14% compared to September 2018 and down 16% compared to September 2017; Month’s Supply of Total Residential Listings is steady at 5 Month’s Supply (Balanced to Buyer’s Market conditions in some areas and product types and price range) and a Sales to Listings Ratio of 56% compared to 29% in September 2018 and 56% in August 2019.

Port Moody: Total Units Sold in September 2019 was 49 – up from 39 (26%) in August 2019, up from 34 (44%) in September 2018, down from 55 (11%) in September 2017; Active Listings are at 233 compared to 245 (down 5%) at this time last year; New Listings in September 2019 were down 18% compared to September 2018 and down 21% compared to September 2017; Month’s Supply of Total Residential Listings is down to 5 Month’s Supply (Balanced Market) and a Sales to Listings Ratio of 52% compared to 29% in September 2018 and 51% in August 2019.

Port Coquitlam: Total Units Sold in September 2019 was 78 – down from 79 (1%) in August 2019, up from 73 (7%) in September 2018, down from 124 (38%) in September 2017; Active Listings are at 340 compared to 345 (down 1%) at this time last year; New Listings in September 2019 were down 12% compared to September 2018 and down 9% compared to September 2017; Month’s Supply of Total Residential Listings is steady at 4 Month’s Supply (Balanced Market) and a Sales to Listings Ratio of 54% compared to 45% in September 2018 and 68% in August 2019.

Ladner: Total Units Sold in September 2019 was 28 – down from 33 (15%) in August 2019, down from 30 (7%) in September 2018, up from 23 (22%) in September 2017; Active Listings are at 185 compared to 177 (up 5%) at this time last year; New Listings in September 2019 were down 30% compared to September 2018 and down 8% compared to September 2017; Month’s Supply of Total Residential Listings is up to 7 Month’s Supply (Balanced to Buyer’s Market conditions in some areas and product types and price range) and a Sales to Listings Ratio of 51% compared to 38% in September 2018 and 49% in August 2019.

Tsawwassen: Total Units Sold in September 2019 was 26 – down from 30 (13%) in August 2019, up from 25 (4%) in September 2018, down from 33 (21%) in September 2017; Active Listings are at 301 compared to 242 (up 24%) at this time last year; New Listings in September 2019 were down 4% compared to September 2018 and down 8% compared to September 2017; Month’s Supply of Total Residential Listings is up to 12 Month’s Supply (Buyer’s Market) and a Sales to Listings Ratio of 33% compared to 30% in September 2018 and 41% in August 2019.

Pitt Meadows: Total Units Sold in September 2019 was 32 – down from 39 (18%) in August 2019, up from 17 (88%) in September 2018, the same as 32 in September 2017; Active Listings are at 111 compared to 127 (down 12%) at this time last year; New Listings in September 2019 were down 12% compared to September 2018 and up 37% compared to September 2017; Month’s Supply of Total Residential Listings is steady at 3 Month’s Supply (Balanced to Seller's Market conditions in some areas and product types and price range) and a Sales to Listings Ratio of 54% compared to 34% in September 2018 and 102% in August 2019.

Maple Ridge: Total Units Sold in September 2019 was 157 – up from 133 (18%) in August 2019, up from 89 (76%) in September 2018, down from 193 (19%) in September 2017; Active Listings are at 822 compared to 709 (up 15%) at this time last year; New Listings in September 2019 were up 3% compared to September 2018 and up 8% compared to September 2017; Month’s Supply of Total Residential Listings is down to 5 Month’s Supply (Balanced to Buyer’s Market conditions in some areas and product types and price range) and a Sales to Listings Ratio of 55% compared to 32% in September 2018 and 63% in August 2019.


Kevin Skipworth
Managing Broker/Partner

Read

Greater Vancouver Sales and Listings Report for August 2019

Attached are the Sales and Listings Stats updated to the end of August 2019. Considering August is traditionally one of the slower months for real estate sales, this August was more active than anticipated. On the supply side, the number of new listings and active listings were down – showing buyers are engaging more than they have and sellers are willing to hold on to their properties. Once again, there is a noticeable increase in demand for homes in August, similar to July, with anecdotal reports of multiple offers and properties that have been on the market for a number of months getting activity and offers. Prices have already come down (despite reports that they are just starting to come down) which has piqued the interest of buyers and allowed some buyers priced out by the mortgage stress test, to come back in to the market.

There were 2,256 homes sold of all types in Greater Vancouver in August this year compared with 2,584 homes sold last month, 1,961 sales in August last year and 3,097 homes sold in August 2017. August sales were 10 per cent below the 10-year average for this month. In the last three market downturns, (2008, 2012 and 2018) August was the start of the market decline. In fact, in 2008 there were 1,654 sales in August and in 2012 there were 1,670 homes sold. This August had a much different feeling to it. With the supply of listings shrinking, buyers have been more engaged and focusing on the more desirably priced homes. There were 711 detached houses sold in August 2019 up from 575 (23 per cent) in August 2018 in Greater Vancouver, with a 9.8 per cent decrease in the benchmark price of these homes year over year. For townhouses there were 409 sales in August 2019 compared to 337 in August 2018 (up 21 per cent) with a 7.8 per cent decrease in the benchmark price year over year; and for condos there were 1,116 sales in August 2019, an increase in sales from 1,025 in August 2018 (up 8 per cent) with an 7.4 per cent decrease in the benchmark price year over year. Houses are getting more and more attention from buyers as the price gap between houses and condos has shrunk and with interest rates coming down, that opportunity will continue to grow.

As for the supply homes in Greater Vancouver, there was a decrease in the number of new listings in August compared to last month and August of last year. There were 3,843 new listings during August in Greater Vancouver, down 3 per cent from August last year and down 12 per cent from August 2017 – the same as July in comparison to the last two years. Clearly there isn’t a panic amongst sellers to list. The number of new listings in August 2019 were 9 per cent below the 10-year average for the month of August. Active Listings are at 14,191 for month end (up 13 per cent compared to August 2018) and after listing expiries at month’s end, there were only 13,813 active listings at the start of September. The month by month drop in active listings is continuing, so with inventory shrinking this is leaving a greater proportion of listings that have been on the market for an extended period of time and the land assembly properties.

The funny thing about supply and demand in today’s real estate market is that the total number of homes in Metro Vancouver has grown considerably since the 1990’s yet total number of monthly sales had been relatively the same during the various market cycles in the last 30 years. Home sales in 2015 and 2016 were among the highest on record, which is to be expected when the total market size has increased significantly. With the limited number of home sales in the last two years, there will be significant pent up demand. And demand is not the same as it was 30 years ago. Demographics show that younger generations are staying single longer, and some when coming together keep both properties making one a rental. Divorce rates are higher than before, requiring one household to turn into 2. And of course, people are living longer and staying in homes longer than before. To suggest that demand for housing comes from population growth and that’s how to determine the need, doesn’t take into account all the other factors that drive the need for homes. And we haven’t even talked about potential effects from Hong Kong. Which begs the question, why is supply not an issue?

“Homes sales returned to more historically normal levels in July and August compared to what we saw in the first six months of the year,” Ashely Smith, Real Estate Board of Greater Vancouver president said. “With more demand from home buyers, the supply of homes listed for sale isn’t accumulating like earlier in the year. These changes are creating more balanced market conditions”

East of the Fraser River, the Fraser Valley Real Estate Board processed 1,297 sales of all property types on its Multiple Listing Service® in August, a decrease of 11 per cent compared to sales in July and a 12.3 per cent increase compared to the 1,155 sales in August of last year. Active listings for the Fraser Valley finished at 8,040, decreasing 3.6 per cent month-over-month and an increase of 9.6 per cent when compared to August 2018. There were 2,357 new listings in August, an 8.5 per cent decrease compared to August 2018. “Compared to last year, this August as been quite robust. All property types are selling and we’re seeing a resurgence in the single-family detached market. Across North Delta, Surrey and Langley, sales are up over 25 per cent.” said Darin Germyn, President of the Fraser Valley Real Estate Board. “It’s great to see. We’re returning to a normal, steady market. Our sales, new listings and number of active listings in August were all slightly below the 10-year average.”

Here’s a summary of the numbers:

Greater Vancouver: Total Units Sold in August 2019 was 2,256 – down from 2,584 (13%) in July 2019, up from 1,961 (15%) in August 2018, down from 3,097 (27%) in August 2017; Active Listings are at 14,191 compared to 12,519 (up 13%) at this time last year; New Listings in August 2019 were down 3% compared to August 2018 and down 12% compared to August 2017; Month’s Supply of Total Residential Listings is steady at 6 Month’s Supply (Balanced to Buyer’s Market conditions in some areas and product types and price range) and a Sales to Listings Ratio of 59% compared to 49% in August 2018 and 55% in July 2019.

Vancouver Westside Residential: Total Units Sold in August 2019 was 423 – down from 489 (13%) in July 2019, up from 371 (14%) in August 2018, down from 516 (18%) in August 2017; Active Listings are at 2,326 compared to 2,158 (up 8%) at this time last year; New Listings in August 2019 were down 12% compared to August 2018 and down 16% compared to August 2017; Month’s Supply of Total Residential Listings is steady at 5 Month’s Supply (Balanced to Buyer’s Market conditions in some areas and product types and price range) and a Sales to Listings Ratio of 67% compared to 51% in August 2018 and 55% in July 2019.

Vancouver Eastside Residential: Total Units Sold in August 2019 was 235 – down from 277 (15%) in July 2019, up from 191 (23%) in August 2018, down from 288 (18%) in August 2017; Active Listings are at 1,233 compared to 1,326 (down 7%) at this time last year; New Listings in August 2019 were down 9% compared to August 2018 and down 14% compared to August 2017; Month’s Supply of Total Residential Listings is steady at 5 Month’s Supply (Balanced to Buyer’s Market conditions in some areas and product types and price range) and a Sales to Listings Ratio of 65% compared to 48% in August 2018 and 59% in July 2019.

North Vancouver Residential: Total Units Sold in August 2019 was 184 – down from 205 (10%) in July 2019, up from 131 (40%) in August 2018, down from 217 (15%) in August 2017; Active Listings are at 838 compared to 739 (up 13%) at this time last year; New Listings in August 2019 were up 3% compared to August 2018 and the same compared to August 2017; Month’s Supply of Total Residential Listings is steady at 5 Month’s Supply (Balanced to Buyer’s Market conditions in some areas and product types and price range) and a Sales to Listings Ratio of 70% compared to 51% in August 2018 and 56% in July 2019.

West Vancouver Houses: Total Units Sold in August 2019 was 49 – down from 59 (17%) in July 2019, up from 46 (6%) in August 2018, down from 50 (2%) in August 2017; Active Listings are at 690 compared to 716 (down 4%) at this time last year; New Listings in August 2019 were down 4% compared to August 2018 and the same compared to August 2017; Month’s Supply of Total Residential Listings is up to 14 Month’s Supply (Buyer’s Market) and a Sales to Listings Ratio of 36% compared to 32% in August 2018 and 39% in July 2019.

Richmond Residential: Total Units Sold in August 2019 was 250 – down from 301 (17%) in July 2019, down from 266 (6%) in August 2018, down from 454 (45%) in August 2017; Active Listings are at 2,210 compared to 1,785 (up 24%) at this time last year; New Listings in August 2019 were down 10% compared to August 2018 and down 26% compared to August 2017; Month’s Supply of Total Residential Listings is up to 9 Month’s Supply (Balanced to Buyer’s Market conditions in some areas and product types and price range) and a Sales to Listings Ratio of 48% compared to 47% in August 2018 and 49% in July 2019.

Burnaby East: Total Units Sold in August 2019 was 31 – up from 14 (221%) in July 2019, up from 21 (48%) in August 2018, up from 30 (3%) in August 2017; Active Listings are at 159 compared to 126 (up 26%) at this time last year; New Listings in August 2019 were up 39% compared to August 2018 and down 7% compared to August 2017; Month’s Supply of Total Residential Listings is down to 5 Month’s Supply (Balanced to Buyer’s Market conditions in some areas and product types and price range) and a Sales to Listings Ratio of 58% compared to 55% in August 2018 and 31% in July 2019.

Burnaby North: Total Units Sold in August 2019 was 129 – down from 132 (2%) in July 2019, up from 82 (57%) in August 2018, down from 166 (22%) in August 2017; Active Listings are at 591 compared to 482 (up 27%) at this time last year; New Listings in August 2019 were down 13% compared to August 2018 and up 3% compared to August 2017; Month’s Supply of Total Residential Listings is steady at 5 Month’s Supply (Balanced to Buyer’s Market conditions in some areas and product types and price range) and a Sales to Listings Ratio of 61% compared to 44% in August 2018 and 56% in July 2019.

Burnaby South: Total Units Sold in August 2019 was 126 – down from 152 (17%) in July 2019, up from 94 (34%) in August 2018, down from 168 (25%) in August 2017; Active Listings are at 792 compared to 614 (up 29%) at this time last year; New Listings in August 2019 were up 22% compared to August 2018 and down 5% compared to August 2017; Month’s Supply of Total Residential Listings is up to 6 Month’s Supply (Balanced to Buyer’s Market conditions in some areas and product types and price range) and a Sales to Listings Ratio of 51% compared to 46% in August 2018 and 64% in July 2019.

New Westminster: Total Units Sold in August 2019 was 97 – down from 122 (20%) in July 2019, up from 90 (7%) in August 2018, down from 170 (43%) in August 2017; Active Listings are at 498 compared to 382 (up 30%) at this time last year; New Listings in August 2019 were up 2% compared to August 2018 and down 19% compared to August 2017; Month’s Supply of Total Residential Listings is up to 5 Month’s Supply (Balanced to Buyer’s Market conditions in some areas and product types and price range) and a Sales to Listings Ratio of 58% compared to 56% in August 2018 and 61% in July 2019.

Coquitlam: Total Units Sold in August 2019 was 198 – down from 236 (16%) in July 2019, up from 183 (8%) in August 2018, down from 249 (20%) in August 2017; Active Listings are at 1,059 compared to 971 (up 9%) at this time last year; New Listings in August 2019 were down 4% compared to August 2018 and down 8% compared to August 2017; Month’s Supply of Total Residential Listings is steady at 5 Month’s Supply (Balanced to Buyer’s Market conditions in some areas and product types and price range) and a Sales to Listings Ratio of 56% compared to 50% in August 2018 and 54% in July 2019.

Port Moody: Total Units Sold in August 2019 was 39 – down from 56 (30%) in July 2019, up from 29 (34%) in August 2018, down from 67 (42%) in August 2017; Active Listings are at 226 compared to 201 (up 12%) at this time last year; New Listings in August 2019 were down 36% compared to August 2018 and down 5% compared to August 2017; Month’s Supply of Total Residential Listings is up to 6 Month’s Supply (Balanced to Buyer’s Market conditions in some areas and product types and price range) and a Sales to Listings Ratio of 51% compared to 52% in August 2018 and 75% in July 2019.

Port Coquitlam: Total Units Sold in August 2019 was 79 – down from 86 (8%) in July 2019, up from 72 (10%) in August 2018, down from 115 (31%) in August 2017; Active Listings are at 338 compared to 336 (up 1%) at this time last year; New Listings in August 2019 were down 21% compared to August 2018 and down 36% compared to August 2017; Month’s Supply of Total Residential Listings is steady at 4 Month’s Supply (Balanced to Buyer’s Market conditions in some areas and product types and price range) and a Sales to Listings Ratio of 68% compared to 49% in August 2018 and 57% in July 2019.

Ladner: Total Units Sold in August 2019 was 33 – down from 34 (3%) in July 2019, up from 23 (43%) in August 2018, down from 40 (17%) in August 2017; Active Listings are at 192 compared to 168 (up 14%) at this time last year; New Listings in August 2019 were up 46% compared to August 2018 and up 86% compared to August 2017; Month’s Supply of Total Residential Listings is steady at 6 Month’s Supply (Balanced to Buyer’s Market conditions in some areas and product types and price range) and a Sales to Listings Ratio of 49% compared to 50% in August 2018 and 58% in July 2019.

Tsawwassen: Total Units Sold in August 2019 was 30 – down from 46 (35%) in July 2019, up from 25 (20%) in August 2018, down from 40 (25%) in August 2017; Active Listings are at 294 compared to 227 (up 30%) at this time last year; New Listings in August 2019 were up 62% compared to August 2018 and up 33% compared to August 2017; Month’s Supply of Total Residential Listings is up to 10 Month’s Supply (Balanced to Buyer’s Market conditions in some areas and product types and price range) and a Sales to Listings Ratio of 41% compared to 56% in August 2018 and 65% in July 2019.

Pitt Meadows: Total Units Sold in July 2019 was 39 – up from 20 (95%) in July 2019, up from 23 (70%) in August 2018, down from 47 (17%) in August 2017; Active Listings are at 118 compared to 117 (up 2%) at this time last year; New Listings in August 2019 were down 19% compared to August 2018 and down 17% compared to August 2017; Month’s Supply of Total Residential Listings down to 3 Month’s Supply (Balanced to Buyer’s Market) and a Sales to Listings Ratio of 102% compared to 48% in August 2018.

Maple Ridge: Total Units Sold in August 2019 was 133 – down from 182 (27%) in July 2019, up from 121 (9%) in August 2018, down from 194 (31%) in August 2017; Active Listings are at 831 compared to 648 (up 28%) at this time last year; New Listings in August 2019 were down 15% compared to August 2018 and up 9% compared to August 2017; Month’s Supply of Total Residential Listings is up to 6 Month’s Supply (Balanced Market) and a Sales to Listings Ratio of 63% compared to 48% in August 2018.


Kevin Skipworth
Managing Broker/Partner


Read

Sales and listings stats are attached as of August 18, 2019. At mid-month in August home sales are performing marginally better than August of last year at mid-month, although last August was the first of nine straight months with home sales in Greater Vancouver below 2,000 units, this August should see the fourth straight month above 2,000 homes sold. While sales are on the increase, new listings are going in the opposite direction. With less homes coming to the market this is creating more competition amongst buyers and resulting in a fewer number of active listings. And with global changes, potential for lower interest rates and continued population growth, the supply issues will once again become the unrecognized factor in Metro Vancouver’s real estate market. Along with the stats is David’s analysis of sales by price point for Westside detached and attached.

Here is a summary of the activity so far:

Greater Vancouver: 1,167 Units Sold so far in August 2019 compared to 1,091 Units Sold at this time in August 2018 and 1,862 at the same time in August 2017. Total New Listings so far in August are 2,161 compared to 2,347 at this time in August 2018 and 2,798 at this time in August 2017. Total Active Listings are at 14,576 (12,679 at the same time in August 2018), Sales To Listings Ratio is at 54% compared to 46% at this time in August 2018.

Vancouver West: 208 Units Sold so far in August 2019 compared to 210 Units Sold at this time in August 2018 and 308 at the same time in August 2017. Total New Listings so far in August are 372 compared to 458 at this time in August 2018 and 483 at this time in August 2017. Total Active Listings are at 2,450 (2,223 at the same time in August 2018), Sales To Listings Ratio is at 56% compared to 46% at this time in August 2018.

Vancouver East: 126 Units Sold so far in August 2019 compared to 103 Units Sold at this time in August 2018 and 184 at the same time in August 2017. Total New Listings so far in August are 195 compared to 239 at this time in August 2018 and 270 at this time in August 2017. Total Active Listings are at 1,294 (1,359 at the same time in August 2018), Sales To Listings Ratio is at 65% compared to 43% at this time in August 2018.

North Vancouver: 102 Units Sold so far in August 2019 compared to 73 Units Sold at this time in August 2018 and 135 at the same time in August 2017. Total New Listings so far in August are 159 compared to 157 at this time in August 2018 and 165 at this time in August 2017. Total Active Listings are at 889 (764 at the same time in August 2018), Sales To Listings Ratio is at 64% compared to 46% at this time in August 2018.

West Vancouver: 25 Units Sold so far in August 2019 compared to 27 Units Sold at this time in August 2018 and 23 at the same time in August 2017. Total New Listings so far in August are 72 compared to 86 at this time in August 2018 and 84 at this time in August 2017. Total Active Listings are at 702 (735 at the same time in August 2018), Sales To Listings Ratio is at 35% compared to 31% at this time in August 2018.

Richmond: 126 Units Sold so far in August 2019 compared to 140 Units Sold at this time in August 2018 and 270 at the same time in August 2017. Total New Listings so far in August are 273 compared to 336 at this time in August 2018 and 425 at this time in August 2017. Total Active Listings are at 2,239 (1,808 at the same time in August 2018), Sales To Listings Ratio is at 46% compared to 42% at this time in August 2018.

Burnaby East: 13 Units Sold so far in August 2019 compared to 11 Units Sold at this time in August 2018. Total New Listings so far in August are 32 compared to 17 at this time in August. Total Active Listings are at 171 (129 at the same time in August 2018), Sales To Listings Ratio is at 41% compared to 65% at this time in August 2018.

Burnaby North: 49 Units Sold so far in August 2019 compared to 49 Units Sold at this time in August 2018. Total New Listings so far in August are 122 compared to 112 at this time in August. Total Active Listings are at 621 (484 at the same time in August 2018), Sales To Listings Ratio is at 49% compared to 44% at this time in August 2018.

Burnaby South: 56 Units Sold so far in August 2019 compared to 57 Units Sold at this time in August 2018. Total New Listings so far in August are 153 compared to 128 at this time in August. Total Active Listings are at 825 (630 at the same time in August 2018), Sales To Listings Ratio is at 37% compared to 45% at this time in August 2018.

New Westminster: 49 Units Sold so far in August 2019 compared to 102 Units Sold at this time in August 2018. Total New Listings so far in August are 102 compared to 95 at this time in August. Total Active Listings are at 516 (392 at the same time in August 2018), Sales To Listings Ratio is at 48% compared to 47% at this time in August 2018.

Coquitlam: 113 Units Sold so far in August 2019 compared to 107 Units Sold at this time in August 2018. Total New Listings so far in August are 203 compared to 215 at this time in August. Total Active Listings are at 1,082 (968 at the same time in August 2018), Sales To Listings Ratio is at 56% compared to 50% at this time in August 2018.

Port Moody: 25 Units Sold so far in August 2019 compared to 21 Units Sold at this time in August 2018. Total New Listings so far in August are 52 compared to 31 at this time in August. Total Active Listings are at 231 (208 at the same time in August 2018), Sales To Listings Ratio is at 48% compared to 68% at this time in August 2018.

Burnaby East: 13 Units Sold so far in August 2019 compared to 11 Units Sold at this time in August 2018. Total New Listings so far in August are 32 compared to 17 at this time in August. Total Active Listings are at 171 (129 at the same time in August 2018), Sales To Listings Ratio is at 41% compared to 65% at this time in August 2018.

Port Coquitlam: 44 Units Sold so far in August 2019 compared to 40 Units Sold at this time in August 2018. Total New Listings so far in August are 57 compared to 77 at this time in August. Total Active Listings are at 352 (327 at the same time in August 2018), Sales To Listings Ratio is at 77% compared to 52% at this time in August 2018.

Ladner: 19 Units Sold so far in August 2019 compared to 15 Units Sold at this time in August 2018. Total New Listings so far in August are 32 compared to 23 at this time in August. Total Active Listings are at 189 (159 at the same time in August 2018), Sales To Listings Ratio is at 59% compared to 65% at this time in August 2018.

Tsawwassen: 14 Units Sold so far in August 2019 compared to 15 Units Sold at this time in August 2018. Total New Listings so far in August are 35 compared to 16 at this time in August. Total Active Listings are at 281 (221 at the same time in August 2018), Sales To Listings Ratio is at 40% compared to 94% at this time in August 2018.

Kevin Skipworth
Managing Broker/Partner


Read

Sales and Listings Report For The End of July 2019

Attached are the Sales and Listings Stats updated to the end of July 2019. It’s down, it’s up, it’s down, it’s up… We wouldn’t expect anything less from the Metro Vancouver real estate market. After a lack lustre June, home sales in July were higher than both June of this year and July last year. A noticeable increase in demand for homes in July, a month that typically sees buyers taking a break from the market. And looking at the number of new listings that came on, sellers may have been the ones taking a break from the market. I hate to say I told you so, but active listings did their best to climb above 15,000 and have now dropped below. Supply isn’t an issue? Only if we don’t want don’t want to keep home prices in check.

There were 2,584 homes sold of all types in Greater Vancouver in July this year compared with 2,098 homes sold last month, 2,018 sales in July last year and 3,012 homes sold in July 2017. This was 8 per cent below the 10-year average for July (compared with 33 per cent below the 10-year average last year in July). It was still the lowest number of homes sold in July since 2012 at 2,135. In fact, 1998 to 2000 saw some of the lowest amounts for sales in the month of July (1,758 in 2000, 2,217 in 1999 and 1,860 in 1998). Considering the commentary of it being a down real estate market, this month showed that buyers are engaging. There were 841 detached houses sold in July 2019 up from 637 (32 per cent) in June in Greater Vancouver, with a 10.5 per cent decrease in the benchmark price of these homes year over year. For townhouses there were 473 sales in July 2019 compared to 354 in July 2018 (up 33.6 per cent) with a 9 per cent decrease in the benchmark price year over year; and for condos there were 1,243 sales in July, an increase in sales from 1,079 in July 2018 (up 15.2 per cent) with an 8.8 per cent decrease in the benchmark price year over year. Buyers are taking advantage of the opportunity to move up and buy into the townhouse and detached home market with their price decreases in the last 2 years.

As for the supply homes in Greater Vancouver, there was a decrease in the number of new listings in July compared to last month and July of last year. There were 4,719 new listings during July in Greater Vancouver, down 3 per cent from July last year and down 12 per cent from July 2017. The number of new listings in July 2019 were 6 per cent below the 10-year average for the month of July. Active Listings are at 15,037 for month end (up 17 per cent compared to July 2018) and after listing expiries at month’s end, there were only 14,469 active listings at the start of August. This was a much more significant drop in listings after July than we’ve seen after the through the month of July in the last 10 years. Over the last 25 years the number of new listings in the last 6 months of the year has been 30 to 35 per cent less than the number of new listings in the first half of the year – so expect the active listing count to drop further and buyers will need to act sooner rather than later to take advantage of buyer market conditions.

The mix of supply currently has 10,000 active listings priced at $1M are more – leaving less than 4,700 active listings priced below $1M in Greater Vancouver. Looking at 13,576 sales in the first 7 months of 2019, there have been only 347 sales above $3M; 672 sales between $2m to $3M; 3,382 sales between $1M to $2M and 9,018 sales below $1M. The competition is clearly in the least suppled range of homes, yet this is not the focus of policy for all levels of government. The provincial government is intent on focusing policy on the least active segment of the market by trying to control that demand. Which begs the question, how are they making housing more affordable by not focusing on the supply of the lower end of the market?

Below is the historical month by month data in Greater Vancouver going back to the early 90’s showing sales, new listings and active listings. The yellow highlighted areas for sales show the slowest months of the market and for active listings, the highest number of active listings we’ve seen in the market. Clearly this latest slowdown in the real estate market saw one of the more prolonged decrease in sales but the least number of active listings for a down market. Sellers are confident and the idea of a significant drop in values won’t happen with that confidence.

“While home sale activity remains below long-term averages, we saw an increase in sales in July compared to the less active spring we experienced,” Ashely Smith, Real Estate Board of Greater Vancouver president said. “Those looking to buy today continue to benefit from the low interest rates, increased selection, and reduced prices compared to the heated market a few years ago.”

East of the Fraser River, the Fraser Valley Real Estate Board processed 1,458 sales of all property types on its Multiple Listing Service® in July, an increase of 11.6 per cent compared to sales in June and a 13 per cent increase compared to the 1,290 sales in July of last year. Active listings for the Fraser Valley finished at 8,340, decreasing 2.1 per cent month-over-month and an increase of 12.7 per cent when compared to July 2018. There were 2,797 new listings in July, a 0.5 per cent decrease compared to June 2019 and a 4.2 per cent decrease compared to July 2018. “We’ve been expecting market improvement, but didn’t quite anticipate July’s momentum. We’ve gone from the worst June in almost 20 years to a July that’s only slightly below the 10-year average,” said Chris Shields, President-Elect of the Fraser Valley Real Estate Board. “We attribute the change in July to pent-up demand and an increase in consumer confidence. REALTORS® in our market saw more activity at open houses, and an increase in the number of first-time buyers.”

Here’s a summary of the numbers:

Greater Vancouver: Total Units Sold in July 2019 was 2,584 – up from 2,098 (23%) in June 2019, up from 2,108 (23%) in July 2018, down from 3,012 (14%) in July 2017; Active Listings are at 15,037 compared to 12,848 (up 17%) at this time last year; New Listings in July 2019 were down 3% compared to July 2018 and down 12% compared to July 2017; Month’s Supply of Total Residential Listings down to 6 Month’s Supply (Balanced to Buyer’s Market conditions in some areas and product types and price range) and a Sales to Listings Ratio of 55% compared to 43% in July 2018.

Vancouver Westside Residential: Total Units Sold in July 2019 was 489 – up from 355 (38%) in June 2019, up from 403 (21%) in July 2018, down from 525 (7%) in July 2017; Active Listings are at 2,572 compared to 2,272 (up 13%) at this time last year; New Listings in July 2019 were up 0.5% compared to July 2018 and down 10% compared to July 2017; Month’s Supply of Total Residential Listings down to 5 Month’s Supply (Balanced Market with higher end homes in Buyer’s Market Conditions) and a Sales to Listings Ratio of 55% compared to 45 in July 2018.

Vancouver Eastside Residential: Total Units Sold in July 2019 was 277 – up from 215 (29%) in June 2019, down from 282 (2%) in July 2018, down from 307 (10%) in July 2017; Active Listings are at 1,341 compared to 1,391 (down 4%) at this time last year; New Listings in July 2019 were down 13% compared to July 2018 and down 13% compared to July 2017; Month’s Supply of Total Residential Listings down to 5 Month’s Supply (Balanced Market) and a Sales to Listings Ratio of 59% compared to 42% in July 2018.

North Vancouver Residential: Total Units Sold in July 2019 was 205 – up from 202 (1%) in June 2019, up from 153 (34%) in July 2018, up from 200 (3%) in July 2017; Active Listings are at 949 compared to 794 (up 20%) at this time last year; New Listings in July 2019 were up 12% compared to July 2018 and up 1% compared to July 2017; Month’s Supply of Total Residential Listings is steady at Month’s Supply (Balanced Market) and a Sales to Listings Ratio of 56% compared to 47% in July 2018.

West Vancouver Houses: Total Units Sold in July 2019 was 59 – up from 43 (37%) in June 2019, up from 57 (4%) in July 2018, up from 56 (5%) in July 2017; Active Listings are at 726 compared to 740 (down 2%) at this time last year; New Listings in July 2019 were down 13% compared to July 2018 and down 13% compared to July 2017; Month’s Supply of Total Residential Listings down to 12 Month’s Supply (Buyer’s Market) and a Sales to Listings Ratio of 39% compared to 33% in July 2018.

Richmond Residential: Total Units Sold in July 2019 was 301 – up from 270 (11%) in June 2019, up from 284 (6%) in July 2018, down from 404 (25%) in July 2017; Active Listings are at 2,309 compared to 1,809 (up 28%) at this time last year; New Listings in July 2019 were down 4% compared to July 2018 and down 24% compared to July 2017; Month’s Supply of Total Residential Listings down to 8 Month’s Supply (Buyer’s Market) and a Sales to Listings Ratio of 49% compared to 44% in July 2018.

Burnaby East: Total Units Sold in July 2019 was 14 – down from 19 (23%) in June 2019, down from 21 (23%) in July 2018, down from 31 (14%) in July 2017; Active Listings are at 166 compared to 138 (up 17%) at this time last year; New Listings in July 2019 were down 18% compared to July 2018 and down 25% compared to July 2017; Month’s Supply of Total Residential Listings up to 12 Month’s Supply (Buyer’s Market) and a Sales to Listings Ratio of 31% compared to 38% in July 2018.

Burnaby North: Total Units Sold in July 2019 was 132 – up from 100 (32%) in June 2019, up from 88 (50%) in July 2018, up from 124 (6%) in July 2017; Active Listings are at 630 compared to 476 (up 32%) at this time last year; New Listings in July 2019 were up 12% compared to July 2018 and down 6% compared to July 2017; Month’s Supply of Total Residential Listings down to 5 Month’s Supply (Balanced Market) and a Sales to Listings Ratio of 56% compared to 42% in July 2018.

Burnaby South: Total Units Sold in July 2019 was 152 – up from 121 (26%) in June 2019, up from 76 (23%) in July 2018, down from 144 (14%) in July 2017; Active Listings are at 807 compared to 646 (up 100%) at this time last year; New Listings in July 2019 were down 8% compared to July 2018 and down 23% compared to July 2017; Month’s Supply of Total Residential Listings down to 5 Month’s Supply (Balanced Market) and a Sales to Listings Ratio of 64% compared to 29% in July 2018.

New Westminster: Total Units Sold in July 2019 was 122 – up from 97 (26%) in June 2019, up from 114 (7%) in July 2018, down from 150 (19%) in July 2017; Active Listings are at 533 compared to 385 (up 38%) at this time last year; New Listings in July 2019 were down 3% compared to July 2018 and down 12% compared to July 2017; Month’s Supply of Total Residential Listings down to 4 Month’s Supply (Balanced Market) and a Sales to Listings Ratio of 61% compared to 55% in July 2018.

Coquitlam: Total Units Sold in July 2019 was 236 – up from 177 (33%) in June 2019, up from 150 (57%) in July 2018, down from 270 (13%) in July 2017; Active Listings are at 1,120 compared to 979 (up 14%) at this time last year; New Listings in July 2019 were down 6% compared to July 2018 and down 6% compared to July 2017; Month’s Supply of Total Residential Listings down to 5 Month’s Supply (Balanced Market) and a Sales to Listings Ratio of 54% compared to 32% in July 2018.

Port Moody: Total Units Sold in July 2019 was 56 – up from 42 (23%) in June 2019, up from 52 (23%) in July 2018, down from 75 (14%) in July 2017; Active Listings are at 236 compared to 218 (up 17%) at this time last year; New Listings in July 2019 were down 31% compared to July 2018 and down 37% compared to July 2017; Month’s Supply of Total Residential Listings down to 4 Month’s Supply (Balanced Market) and a Sales to Listings Ratio of 75 compared to 48% in July 2018.

Port Coquitlam: Total Units Sold in July 2019 was 86 – up from 77 (12%) in June 2019, down from 108 (20%) in July 2018, down from 120 (38%) in July 2017; Active Listings are at 381 compared to 330 (up 15%) at this time last year; New Listings in July 2019 were down 3% compared to July 2018 and down 12% compared to July 2017; Month’s Supply of Total Residential Listings down to 4 Month’s Supply (Balanced Market) and a Sales to Listings Ratio of 57% compared to 45% in July 2018.

Ladner: Total Units Sold in July 2019 was 34 – up from 33 (3%) in June 2019, up from 29 (17%) in July 2018, down from 46 (26%) in July 2017; Active Listings are at 190 compared to 164 (up 16%) at this time last year; New Listings in July 2019 were up 34% compared to July 2018 and up 9% compared to July 2017; Month’s Supply of Total Residential Listings steady at 6 Month’s Supply (Balanced to Buyer’s Market conditions in some areas and product types and price range) and a Sales to Listings Ratio of 58% compared to 66% in July 2018.

Tsawwassen: Total Units Sold in July 2019 was 46 – up from 35 (31%) in June 2019, up from 23 (100%) in July 2018, up from 43 (7%) in July 2017; Active Listings are at 287 compared to 253 (up 13%) at this time last year; New Listings in July 2019 were up 15% compared to July 2018 and down 7% compared to July 2017; Month’s Supply of Total Residential Listings down to 6 Month’s Supply (Balanced to Buyer’s Market) and a Sales to Listings Ratio of 65% compared to 37% in July 2018.

Pitt Meadows: Total Units Sold in July 2019 was 20 – down from 24 (17%) in June 2019, down from 25 (20%) in July 2018, down from 25 (20%) in July 2017; Active Listings are at 139 compared to 109 (up 28%) at this time last year; New Listings in July 2019 were down 3% compared to July 2018 and up 12% compared to July 2017; Month’s Supply of Total Residential Listings down to 7 Month’s Supply (Balanced to Buyer’s Market) and a Sales to Listings Ratio of 40% compared to 48% in July 2018.

Maple Ridge: Total Units Sold in July 2019 was 182 – up from 132 (38%) in June 2019, up from 130 (40%) in July 2018, down from 213 (15%) in July 2017; Active Listings are at 870 compared to 614 (up 35%) at this time last year; New Listings in July 2019 were up 18% compared to July 2018 and up 2% compared to July 2017; Month’s Supply of Total Residential Listings is steady at 5 Month’s Supply (Balanced Market) and a Sales to Listings Ratio of 56% compared to 47% in July 2018.

Read

Sales and listings stats are attached as of July 21, 2019. I remember a comment from this very analyst that writes these updates that sales were showing signs of increasing and total active listings were struggling to stay above 15,000 homes. Sales for July are so far tracking at about 15 per cent above the levels of last July at this time, with new listings down 9 per cent and active listings falling. We are likely to see sales in Greater Vancouver finish July at 2,500 homes sold which would be 19 per cent above the number of sales in June. Vancouver’s West Side is showing some of the better numbers for far, with detached home sales at the same level as June already. Active listings are down to 15,385 after peaking at 15,770 at the end of June. The federal government reduced the stress test rate to 5.19 per cent, down from 5.34 per cent. While not a significant amount, a sign that rates for borrowing are dropping and could spark further interest from buyers. Fixed rates are down approximately 0.7 per cent since going up – begging the question as to why the government only dropped the stress test rate by 0.15 per cent!

Here is a summary of the activity so far:

Greater Vancouver: 1,609 units sold so far in July 2019 compared to 1,398 units sold as of July 22, 2018. Total New Listings so far in July are 3,260 compared to 3,492 units listed as of July 22, 2018. Total Active Listings are at 15,385 (12,920 at the same time last year). Sales To Listings Ratio is at 49% compared to 43% in June 2019.

Vancouver West: 322 units sold so far in July 2019 compared to 263 units sold as of July 22, 2018. Total New Listings so far in July are 623 compared to 644 units listed as of July 22, 2018. Total Active Listings are at 2,644 (2,327 at the same time last year). Sales To Listings Ratio is at 52% compared to 40% in June 2019

Vancouver East: 164 units sold so far in July 2019 compared to 141 units sold as of July 22, 2018. Total New Listings so far in July are 348 compared to 382 units listed as of July 22, 2018. Total Active Listings are at 1,404 (1,417 at the same time last year). Sales To Listings Ratio is at 47% compared to 44% in June 2019

North Vancouver: 115 units sold so far in July 2019 compared to 104 units sold as of July 22, 2018. Total New Listings so far in July are 267 compared to 237 units listed as of July 22, 2018. Total Active Listings are at 1,020 (808 at the same time last year). Sales To Listings Ratio is at 43% compared to 49% in June 2019

West Vancouver: 32 units sold so far in July 2019 compared to 42 units sold as of July 22, 2018. Total New Listings so far in July are 102 compared to 123 units listed as of July 22, 2018. Total Active Listings are at 741 (742 at the same time last year). Sales To Listings Ratio is at 31% compared to 24% in June 2019

Richmond: 192 units sold so far in July 2019 compared to 178 units sold as of July 22, 2018. Total New Listings so far in July are 422 compared to 467 units listed as of July 22, 2018. Total Active Listings are at 2,338 (1,831 at the same time last year). Sales To Listings Ratio is at 45% compared to 43% in June 2019

Burnaby East: 9 units sold so far in July 2019 compared to 13 units sold as of July 22, 2018. Total New Listings so far in July are 33 compared to 41 units listed as of July 22, 2018. Total Active Listings are at 166 (141 at the same time last year). Sales To Listings Ratio is at 27% compared to 38% in June 2019

Burnaby North: 85 units sold so far in July 2019 compared to 61 units sold as of July 22, 2018. Total New Listings so far in July are 165 compared to 151 units listed as of July 22, 2018. Total Active Listings are at 648 (490 at the same time last year). Sales To Listings Ratio is at 52% compared to 43% in June 2019

Burnaby South: 96 units sold so far in July 2019 compared to 74 units sold as of July 22, 2018. Total New Listings so far in July are 163 compared to 197 units listed as of July 22, 2018. Total Active Listings are at 830 (637 at the same time last year). Sales To Listings Ratio is at 59% compared to 45% in June 2019

New Westminster: 84 units sold so far in July 2019 compared to 74 units sold as of July 22, 2018. Total New Listings so far in July are 124 compared to 149 units listed as of July 22, 2018. Total Active Listings are at 540 (391 at the same time last year). Sales To Listings Ratio is at 68% compared to 48% in June 2019

Coquitlam: 144 units sold so far in July 2019 compared to 100 units sold as of July 22, 2018. Total New Listings so far in July are 289 compared to 325 units listed as of July 22, 2018. Total Active Listings are at 1,152 (954 at the same time last year). Sales To Listings Ratio is at 50% compared to 46% in June 2019

Port Moody: 32 units sold so far in July 2019 compared to 32 units sold as of July 22, 2018. Total New Listings so far in July are 51 compared to 76 units listed as of July 22, 2018. Total Active Listings are at 249 (219 at the same time last year). Sales To Listings Ratio is at 63% compared to 48% in June 2019

Port Coquitlam: 52 units sold so far in July 2019 compared to 56 units sold as of July 22, 2018. Total New Listings so far in July are 105 compared to 130 units listed as of July 22, 2018. Total Active Listings are at 583 (325 at the same time last year). Sales To Listings Ratio is at 50% compared to 44% in June 2019

Ladner: 25 units sold so far in July 2019 compared to 23 units sold as of July 22, 2018. Total New Listings so far in July are 39 compared to 30 units listed as of July 22, 2018. Total Active Listings are at 184 (162 at the same time last year). Sales To Listings Ratio is at 64% compared to 47% in June 2019

Tsawwassen: 25 units sold so far in July 2019 compared to 18 units sold as of July 22, 2018. Total New Listings so far in July are 51 compared to 40 units listed as of July 22, 2018. Total Active Listings are at 301 (249 at the same time last year). Sales To Listings Ratio is at 49% compared to 44% in June 2019


Kevin Skipworth
Managing Broker/Partner


dexterrealty.com
cathieandkevin.com

Once again I’m taking part in the Ride To Conquer Cancer in 2019 with a goal of raising $7,500. To help me reach my goal please go to www.conquercancer.ca/goto/KevinS

“Being challenged in life is inevitable, being defeated is optional.” Roger Crawford


Read

VANCOUVER, JUNE 6, 2019/ Kevin Skipworth, Chief Economist at Dexter Realty, publishes his latest face-based estate report highlighting the real story behind sales and listings stats. 

Having been in the residential real estate business for many cycles we at Dexter Realty believe the Metro Vancouver resale real estate market is primed for a comeback! Never before have we seen sales and listings numbers like we are experiencing right now. Even with monthly sales transactions below that of a typical May and below the 10-year average, fundamentals shown by new and active listing counts demonstrate that, despite some reports painting a bleak picture in real estate, we actually see renewed confidence as evidenced by recent sales and these new and active listing counts. Sales in May were 44% above those in April, as such, it’s not a slumping market, but one with a gasp of breath. Ask REALTORS® how many multiple offers they have experienced in the last month? Lack of Supply is the story!

When you look at the numbers, over the past 20 years we’ve seen 3 significant slow downs in Vancouver real estate. During the periods between 1997 to 1999, 2008 to 2009 and 2012 to 2013 monthly home sales in Greater Vancouver persisted below 2,000 units. In each of these periods, there were either over or close to 20,000 listings on the market. In this current cycle we are seeing the market struggle to get over 15,000 active listings—at a time when the overall housing stock is at its highest! Demand is and will increase, and supply is clearly less than other significant slower markets.

As an example, click on the following link to view a graph of real estate data since 1992 that I created. The numbers are from the Real Estate Board of Greater Vancouver.

The lack of homes listed during one of the slowest markets we’ve encountered in 30 years shows that sellers are not looking to “panic sell”—some will sell out of need and agree to prices below what they would like, others will hold and wait. There is confidence in the Metro Vancouver real estate market long term—with more buyers and fewer sellers, it will lead to stabilization in the market. We may be seeing prices bottom out in the lower and middle end of the market, but there are still great opportunities for buyers, however they are diminishing.

Supply of homes, especially the right supply, will continue to be an issue without being addressed by government at all levels. With increased taxes and costs, as well as restrictive zoning, developers are pulling back and we'll see a lack of new supply and especially the right supply in the next 2 to 4 years. That, coupled with low resale inventories, significant pent up demand, a growing population and Metro Vancouver being a region where people gravitate to, the cycle will continue with demand outstripping supply and prices rising. 

The market is always right—supply and demand ultimately dictates market conditions. The recent intervention on the demand side by the provincial government through taxes and the federal government through the stress test only served to reduce prices significantly in the high end for those the government wanted out of this market and, unwittingly, prevented home buyers from getting into homes in the lower end. Thus affordability overall has not improved and will not get any better without a serious look at the ill-conceived government policies and other factors keeping new homes from making it through the rezoning process to completion.


Kevin Skipworth, B.A. Economics
Partner/Managing Broker & Chief Economist
Dexter Realty
604-868-3656
kevin@skipworth.ca

Kevin produces a bi-monthly statistical report providing up to date sales and listing numbers for Greater Vancouver and its sub areas. Contact Kevin to receive these reports. 

Read

Is this a one hit wonder or the start of a new album for Metro Vancouver real estate? Sales in May were the highest since May 2018 and second highest since November 2017. After 9 straight months with home sales below 2,000 units, there were 2,669 homes sold in Greater Vancouver in May. This was the longest period of monthly sales being below 2,000 since a period of 16 months from November 1997 to February 1999. With the spring market typically being the busy time of year for buyers and sellers, it seems engagement through the end of April and into May was much higher than we’ve seen over the last month. And with all that has been thrown at the market, it shouldn’t be surprising that it took time for the market and its participants to digest. And with less listings coming on the market in May than is typical, total inventory level growth has slowed, resulting in some multiple offers in the market – albeit with a more cautious tone to them. It would seem pent up demand in the market is coming out from the stalemate we’ve seen over the last year. The question is, will this continue. Certainly, with the economy still performing well, population growing and the continued love affair with our region, there is little to keep the market activity from stabilizing. Not to be confused with price growth, which will take longer to recover, but make no mistake it will.

The 2,669 homes sold in Greater Vancouver in May were up from 1,850 (44%) from April this year. The largest month over month increase since March 2017. This was compared with 2,890 sales (down 8%) in May last year and 4,425 sales in May 2017, the largest year over year increase since February 2018. And this was 23 per cent below the 10-year average for May unit sales in Greater Vancouver. The detached house market was stronger in May than we’ve seen in the last year – with areas like Richmond, North Vancouver, New Westminster and Port Moody (up 43 per cent to May 2018), showing better performance year over year compared to the condo and townhouse markets.

On the other side of the equation, there were 6,031 new listings in May in Greater Vancouver, down from 6,558 in May last year and up from 5900 in April 2019. The number of new listings in May were 5 per cent below the 10-year average for May. There are currently 15,452 Active Listings on the market in Greater Vancouver – up from 11,989 at the end of May last year. A combination of lower new listings and higher home sales volumes have slowed down the rate of growth of Active Listings, not typical during a slow real estate market. In the period of 1997 to 1999, Active Listings were consistently at levels of 20,000 – at a time when there were far less homes available for sale in the Greater Vancouver market. Similarly, in the two slowest markets since in 2008 and 2012 to the beginning of 2014, Active Listings were near 20,000 during that period. While this has been one of the slower real estate markets we’ve seen in 20 years, the lack of homes being listed indicates the strength of the market and that prices may not fall much further. And certainly, if buyers engage as they have done this month, that will keep prices consistent. Of course, not all segments of the market operate the same, with the higher end of the market still struggling to recover and further price declines possible.

“High home prices and mortgage qualification issues caused by the federal government’s B20 stress test remain significant factors behind the reduced demand that the market is experiencing today,” Ashley Smith, Real Estate Board of Greater Vancouver president said. “Whether you’re a buyer looking to make an offer or a seller looking to list your home, getting your pricing right is the key in today’s market.”

The Fraser Valley Real Estate Board processed 1,517 sales of all property types on its MLS® in May, a 9.7 per cent increase compared to sales in April 2019, and a 13.7 per cent decrease compared to the 1,758 sales in May of last year. Of the 1,517 total sales, 41.2 per cent, up from 39.4 per cent in April; attached homes were 58.8 per cent of total sales in May compared to 60.6 per cent in April. “Buyers are recognizing that in the last three months, home prices have stopped declining and that in order to take advantage of the improvement in prices over the past year, now is a great time to consider making the purchase they held off on in the previous months,” Darin Germyn, President of the Fraser Valley Real Estate Board, said “We’re seeing buyers who have been waiting on the sidelines, act, because of better price opportunities and more selection. It’s been four years since buyers had this much choice in the Fraser Valley.”

Here’s a summary of the numbers: 

Greater Vancouver: Total Units Sold in May 2019 was 2,669 – up from 1,850 (44%) in April 2019, down from 2,890 (8%) in May 2018, down from 4,425 (40%) in May 2017; Active Listings are at 15,452 compared to 11,980 at this time last year (up 29%); New Listings in May 2019 were up 2% compared to April 2019; were down 8% compared to May 2018 and down 3% compared to May 2017; Month’s Supply of Total Residential Listings is down to 6 Month’s Supply (Balanced to Buyer’s Market) and a Sales to Listings Ratio of 44% compared to 31% in April 2019 and 44% in May 2018.

Vancouver Westside Residential: Total Units Sold in May 2019 was 460 – up from 342 (35%) in April 2019, down from 504 (9%) in May 2018, down from 796 (42%) in May 2017; Active Listings are at 2,778 compared to 2,276 at this time last year (up 22%); New Listings in May 2019 were down 10% compared to April 2019; were down 17% compared to May 2018 and down 2% compared to May 2017; Month’s Supply of Total Residential Listings is down to 6 Month’s Supply (Balanced to Buyer’s Market) and a Sales to Listings Ratio of 44% compared to 29% in April 2019 and 40% in May 2018.

Vancouver Eastside Residential: Total Units Sold in May 2019 was 328 – up from 215 (53%) in April 2019, down from 364 (10%) in May 2018, down from 467 (30%) in May 2017; Active Listings are at 1,403 compared to 1,323 at this time last year (up 6%); New Listings in May 2019 were up 3% compared to April 2019; were down 16% compared to May 2018 and down 9% compared to May 2017; Month’s Supply of Total Residential Listings is down to 4 Month’s Supply (Balanced Market) and a Sales to Listings Ratio of 54% compared to 36% in April 2019 and 50% in May 2018.

North Vancouver Residential: Total Units Sold in May 2019 was 257 – up from 149 (72%) in April 2019, up from 238 (8%) in May 2018, down from 325 (21%) in May 2017; Active Listings are at 1,035 compared to 764 at this time last year (up 35%); New Listings in May 2019 were the same as April 2019; were down 3% compared to May 2018 and up 2% compared to May 2017; Month’s Supply of Total Residential Listings is down to 4 Month’s Supply (Balanced Market) and a Sales to Listings Ratio of 50% compared to 29% in April 2019 and 45% in May 2018.

West Vancouver Houses: Total Units Sold in May 2019 was 71 – up from 48 (48%) in April 2019, up from 63 (13%) in May 2018, down from 100 (29%) in May 2017; Active Listings are at 740 compared to 744 at this time last year (down 1%); New Listings in May 2019 were down 6% compared to April 2019; were down 21% compared to May 2018 and down 4% compared to May 2017; Month’s Supply of Total Residential Listings is down to 10 Month’s Supply (Buyer’s Market) and a Sales to Listings Ratio of 30% compared to 19% in April 2019 and 21% in May 2018.

Richmond Residential: Total Units Sold in May 2019 was 271 – up from 172 (58%) in April 2019, down from 358 (24%) in May 2018, down from 563 (52%) in May 2017; Active Listings are at 2,329 compared to 1,680 at this time last year (up 39%); New Listings in May 2019 were up 10% compared to April 2019; were up 14% compared to May 2018 and down 3% compared to May 2017; Month’s Supply of Total Residential Listings is down to 9 Month’s Supply (Buyer’s Market) and a Sales to Listings Ratio of 35% compared to 25% in April 2019 and 41% in May 2018.

Burnaby East: Total Units Sold in May 2019 was 25 – up from 15 (67%) in April 2019, down from 29 (14%) in May 2018, down from 36 (31%) in May 2017; Active Listings are at 149 compared to 144 at this time last year (up 3%); New Listings in May 2019 were down 12% compared to April 2019; were down 32% compared to May 2018 and down 19% compared to May 2017; Month’s Supply of Total Residential Listings is down to 6 Month’s Supply (Balanced to Buyer’s Market) and a Sales to Listings Ratio of 50% compared to 26% in April 2019 and 39% in May 2018.

Burnaby North: Total Units Sold in May 2019 was 123 – up from 81 (52%) in April 2019, down from 147 (16%) in May 2018, down from 217 (43%) in May 2017; Active Listings are at 655 compared to 425 at this time last year (up 54%); New Listings in May 2019 were the same compared to April 2019; were up 5% compared to May 2018 and down 11% compared to May 2017; Month’s Supply of Total Residential Listings is down to 5 Month’s Supply (Balanced to Buyer’s Market) and a Sales to Listings Ratio of 44% compared to 29% in April 2019 and 55% in May 2018.

Burnaby South: Total Units Sold in May 2019 was 131 – up from 97 (35%) in April 2019, up from 127 (3%) in May 2018, down from 250 (48%) in May 2017; Active Listings are at 841 compared to 532 at this time last year (up 58%); New Listings in May 2019 were up 14% compared to April 2019; were up 3% compared to May 2018 and down 11% compared to May 2017; Month’s Supply of Total Residential Listings is down to 6 Month’s Supply (Balanced to Buyer’s Market) and a Sales to Listings Ratio of 40% compared to 34% in April 2019 and 40% in May 2018.

New Westminster: Total Units Sold in May 2019 was 127 – up from 108 (18%) in April 2019, down from 132 (4%) in May 2018, down from 227 (44%) in May 2017; Active Listings are at 562 compared to 351 at this time last year (up 60%); New Listings in May 2019 were down 5% compared to April 2019; were up 5% compared to May 2018 and up 10% compared to May 2017; Month’s Supply of Total Residential Listings is down to 4 Month’s Supply (Balanced Market) and a Sales to Listings Ratio of 47% compared to 38% in April 2019 and 51% in May 2018.

Coquitlam: Total Units Sold in May 2019 was 205 – up from 153 (34%) in April 2019, up from 200 (3%) in May 2018, down from 365 (45%) in May 2017; Active Listings are at 1,140 compared to 809 at this time last year (up 41%); New Listings in May 2019 were up 12% compared to April 2019; were up 5% compared to May 2018 and up 7% compared to May 2017; Month’s Supply of Total Residential Listings is down to 6 Month’s Supply (Balanced to Buyer’s Market) and a Sales to Listings Ratio of 39% compared to 33% in April 2019 and 40% in May 2018.

Port Moody: Total Units Sold in May 2019 was 62 – up from 60 (3%) in April 2019, down from 64 (3%) in May 2018, down from 105 (41%) in May 2017; Active Listings are at 264 compared to 191 at this time last year (up 38%); New Listings in May 2019 were down 12% compared to April 2019; were down 2% compared to May 2018 and down 6% compared to May 2017; Month’s Supply of Total Residential Listings is steady at 4 Month’s Supply (Balanced Market) and a Sales to Listings Ratio of 49% compared to 41% in April 2019 and 50% in May 2018.

Port Coquitlam: Total Units Sold in May 2019 was 132 – up from 67 (97%) in April 2019, up from 104 (27%) in May 2018, down from 171 (23%) in May 2017; Active Listings are at 362 compared to 275 at this time last year (up 32%); New Listings in May 2019 were down 5% compared to April 2019; were down 20% compared to May 2018 and down 16% compared to May 2017; Month’s Supply of Total Residential Listings is down to 3 Month’s Supply (Balanced to Seller’s Market) and a Sales to Listings Ratio of 71% compared to 34% in April 2019 and 44% in May 2018.

Ladner: Total Units Sold in May 2019 was 41 – up from 29 (41%) in April 2019, down from 36 (14%) in May 2018, down from 59 (31%) in May 2017; Active Listings are at 208 compared to 156 at this time last year (up 33%); New Listings in May 2019 were up 32% compared to April 2019; were up 3% compared to May 2018 and up 43% compared to May 2017; Month’s Supply of Total Residential Listings is down to 5 Month’s Supply (Balanced to Buyer’s Market) and a Sales to Listings Ratio of 48% compared to 45% in April 2019 and 43% in May 2018.

Tsawwassen: Total Units Sold in May 2019 was 38 – up from 18 (111%) in April 2019, up from 35 (9%) in May 2018, down from 47 (19%) in May 2017; Active Listings are at 305 compared to 266 at this time last year (up 15%); New Listings in May 2019 were down 14% compared to April 2019; were up 6% compared to May 2018 and up 13% compared to May 2017; Month’s Supply of Total Residential Listings is down to 8 Month’s Supply (Balanced to Buyer’s Market) and a Sales to Listings Ratio of 40% compared to 17% in April 2019 and 39% in May 2018.

Pitt Meadows: Total Units Sold in May 2019 was 40 – up from 28 (43%) in April 2019, up from 39 (3%) in May 2018, down from 72 (44%) in May 2017; Active Listings are at 137 compared to 84 at this time last year (up 63%); New Listings in May 2019 were down 17% compared to April 2019; were down 11% compared to May 2018 and down 35% compared to May 2017; Month’s Supply of Total Residential Listings is down to 3 Month’s Supply (Balanced to Seller’s Market) and a Sales to Listings Ratio of 66% compared to 38% in April 2019 and 57% in May 2018.

Maple Ridge: Total Units Sold in May 2019 was 171 – up from 124 (38%) in April 2019, down from 188 (9%) in May 2018, down from 292 (41%) in May 2017; Active Listings are at 832 compared to 592 at this time last year (up 40%); New Listings in May 2019 were up 7% compared to April 2019; the same compared to May 2018 and the same compared to May 2017; Month’s Supply of Total Residential Listings is down to 5 Month’s Supply (Balanced Market) and a Sales to Listings Ratio of 47% compared to 36% in April 2019 and 51% in May 2018.


Kevin Skipworth
Managing Broker/Partner


Read

Attached are the Sales and Listings Stats updated to the end of April 2019. Not much is changing in the market in relation to sales numbers, we are seeing total number of homes sold consistently below 2,000 since July of 2018. But on a positive note, it was the 4 straight increase months over month. Rome wasn’t built in a day nor is the Greater Vancouver housing market. The pent-up demand continues to build as a result. There were 1,850 sales in Greater Vancouver in March 2019, the lowest total for the month of April since 1995. The standoff continues between buyers and sellers as both sides are waiting for the other to blink. Increasingly sellers are starting to blink first as buyers are being very selective on what they are willing to offer on and jumping on properties that are priced well in today’s market. An opportunity that has been long sought after from buyers in Metro Vancouver.

The 1,850 homes sold in Greater Vancouver in April were up from 1,745 (6%) from March this year. This was compared with 2,631 sales (down 30%) in April last year and 3,617 sales in March 2017. This was 45 per cent below the 10-year average for April. Around the region, North Vancouver and Richmond saw total home sales decline in April compared to March – while all other regions saw sales increase in April. Port Moody had the largest increase in sales in April compared to March.

On the other side of the equation, there were 5,900 new listings in April in Greater Vancouver, down from 5,943 in April last year and up from 5,057 in March 2019. The number of new listings in April were 2 per cent below the 10-year average for April. There are currently 15,050 Active Listings on the market in Greater Vancouver – up from 10,474 at the end of April last year. This is the highest number of Active listings since September 2014. While Active Listings are up 44 per cent to last year, this trended down 4% compared to March year over year. But clearly the growth in listings is attributed to the lack of home sales occurring in the market. New Listings are not occurring at a higher rate comparative to previous years. Buyers have a lot more choice than they have had in the past though making for opportunity.

“Government policy continues to hinder home sale activity. The federal government’s mortgage stress test has reduced buyers’ purchasing power by about 20 per cent, which is causing people at the entry-level side of the market to struggle to secure financing,” Ashley Smith, Real Estate Board of Greater Vancouver president said. “Suppressing housing activity through government policy not only reduces home sales, it harms the job market, economic growth and creates pent-up demand.”

The Fraser Valley Real Estate Board processed 1,383 sales of all property types on its MLS® in April, a 13.3 per cent increase compared to sales in March 2019, and a 19 per cent decrease compared to the 1,708 sales in April of last year. Of the 1,383 total sales, 489 were residential detached homes, 379 were townhouses, and 374 apartments. “Consumers may not have the purchasing power that they did prior to January 2018, but the desire for home ownership is still there and we’re seeing that reflected in our MLS® data,” Darin Germyn, President of the Fraser Valley Real Estate Board, said “A slower, stable market has had a positive impact on affordability in our region. Prices of typical residential homes in the Fraser Valley have decreased between 5 and 6 per cent in the last year. In the last three months, benchmark prices have either plateaued or have experienced a small recovery.”

Here’s a summary of the numbers:

Greater Vancouver: Total Units Sold in April 2019 was 1,850 – up from 1,745  (6%) in March 2019, down from 2,631 (30%) in April 2018, down from 3,617 (49%) in April 2017; Active Listings are at 15,060 compared to 10,474 at this time last year (up 44%); New Listings in April 2019 were up 17% compared to March 2019; were down 1% compared to April 2018 and up 18% compared to April 2017; Month’s Supply of Total Residential Listings is steady at 8 Month’s Supply (Buyer’s Market) and a Sales to Listings Ratio of 31% compared to 35% in March 2019.

Vancouver Westside Residential: Total Units Sold in April 2019 was 342 – up from 333  (3%) in March 2019, down from 441 (22%) in April 2018, down from 613 (44%) in April 2017; Active Listings are at 2,808 compared to 1,985 at this time last year (up 41%); New Listings in April 2019 were up 18% compared to March 2019; were the same compared to April 2018 and up 34% compared to April 2017; Month’s Supply of Total Residential Listings is steady at 8 Month’s Supply (Buyer’s Market) and a Sales to Listings Ratio of 29% compared to 34% in March 2019.

Vancouver Eastside Residential: Total Units Sold in April 2019 was 215 – up from 174 (24%) in March 2019, down from 298 (28%) in April 2018, down from 355 (39%) in April 2017; Active Listings are at 1,403 compared to 1,223 at this time last year (15%); New Listings in April 2019 were up 16% compared to March 2019; were down 17% compared to April 2018 and up 1% compared to April 2017; Month’s Supply of Total Residential Listings is steady at 7 Month’s Supply (Buyer’s Market) and a Sales to Listings Ratio of 36% compared to 34% in March 2019.

North Vancouver Residential: Total Units Sold in April 2019 was 149 – down from 165 (10%) in March 2019, down from 221 (33%) in April 2018, down from 255 (42%) in April 2017; Active Listings are at 1,049 compared to 635 at this time last year (up 65%); New Listings in April 2019 were up 26% compared to March 2019; were up 7% compared to April 2018 and up 44% compared to April 2017; Month’s Supply of Total Residential Listings is up to 7 Month’s Supply (Buyer’s Market) and a Sales to Listings Ratio of 29% compared to 42% in March 2019.

West Vancouver Houses: Total Units Sold in April 2019 was 48 – up from 34 (41%) in March 2019, down from 56 (14%) in April 2018, down from 100 (52%) in April 2017; Active Listings are at 723 compared to 653 at this time last year (up 11%); New Listings in April 2019 were up 48% compared to March 2019; were down 12% compared to April 2018 and up 13% compared to April 2017; Month’s Supply of Total Residential Listings is down to 15 Month’s Supply (Buyer’s Market) and a Sales to Listings Ratio of 19% compared to 20% in March 2019.

Richmond Residential: Total Units Sold in April 2019 was 172 – down from 178 (3%) in March 2019, down from 312 (44%) in April 2018, down from 510 (66%) in April 2017; Active Listings are at 2,220 compared to 1,475 at this time last year (up 51%); New Listings in April 2019 were up 4% compared to March 2019; were up 1% compared to April 2018 and up 8% compared to April 2017; Month’s Supply of Total Residential Listings is up to 13 Month’s Supply (Buyer’s Market) and a Sales to Listings Ratio of 25% compared to 26% in March 2019.

Burnaby East: Total Units Sold in April 2019 was 15 down from 17 (12%) in March 2019, down from 35 (51%) in April 2018, down from 46 (63%) in April 2017; Active Listings are at 153 compared to 120 at this time last year (up 28%); New Listings in April 2019 were up 12% compared to March 2019; were down 14% compared to April 2018 and down 5% compared to April 2017; Month’s Supply of Total Residential Listings is up to 10 Month’s Supply (Buyer’s Market) and a Sales to Listings Ratio of 26% compared to 33% in March 2019.

Burnaby North: Total Units Sold in April 2019 was 81 – up from 77 (5%) in March 2019, down from 135 (40%) in April 2018, down from 200 (59%) in April 2017; Active Listings are at 634 compared to 387 at this time last year (up 64%); New Listings in April 2019 were up 26% compared to March 2019; were up 1% compared to April 2018 and up 8% compared to April 2017; Month’s Supply of Total Residential Listings is up to 8 Month’s Supply (Buyer’s Market) and a Sales to Listings Ratio of 29% compared to 34% in March 2019

Burnaby South: Total Units Sold in April 2019 was 97– the same as March 2019, down from 108 (10%) in April 2018, down from 164 (41%) in April 2017; Active Listings are at 819 compared to 467 at this time last year (up 75%); New Listings in April 2019 were down 3% compared to March 2019; were up 1% compared to April 2018 and up 8% compared to April 2017; Month’s Supply of Total Residential Listings is steady at 8 Month’s Supply (Buyer’s Market) and a Sales to Listings Ratio of 34% compared to 33% in March 2019.

New Westminster: Total Units Sold in April 2019 was 108 – up from 81 (33%) in March 2019, down from 133 (19%) in April 2018, down from 179 (40%) in April 2017; Active Listings are at 533 compared to 286 at this time last year (up 86%); New Listings in April 2019 were up 41% compared to March 2019; were up 21% compared to April 2018 and up 34% compared to April 2017; Month’s Supply of Total Residential Listings is down to 5 Month’s Supply (Balanced Market) and a Sales to Listings Ratio of 38% compared to 40% in March 2019.

Coquitlam: Total Units Sold in April 2019 was 153 – up from 142 (8%) in March 2019, down from 202 (24%) in April 2018, down from 295 (48%) in April 2017; Active Listings are at 1,068 compared to 809 at this time last year (up 32%); New Listings in April 2019 were up 2% compared to March 2019; were up 2% compared to April 2018 and up 17% compared to April 2017; Month’s Supply of Total Residential Listings is steady at 7 Month’s Supply (Buyer’s Market) and a Sales to Listings Ratio of 33% compared to 35% in March 2019.

Port Moody: Total Units Sold in April 2019 was 60 – up from 38 (58%) in March 2019, up from 54 (11%) in April 2018, down from 85 (29%) in April 2017; Active Listings are at 252 compared to 155 at this time last year (up 63%); New Listings in April 2019 were up 53% compared to March 2019; were up 28% compared to April 2018 and up 12% compared to April 2017; Month’s Supply of Total Residential Listings is down to 4 Month’s Supply (Balanced Market) and a Sales to Listings Ratio of 41% compared to 40% in March 2019.

Port Coquitlam: Total Units Sold in April 2019 was 67 – up from 59 (14%) in March 2019, down from 103 (35%) in April 2018, down from 121 (45%) in April 2017; Active Listings are at 395 compared to 197 at this time last year (up 101%); New Listings in April 2019 were up 17% compared to March 2019; were up 7% compared to April 2018 and up 32% compared to April 2017; Month’s Supply of Total Residential Listings is steady at 6 Month’s Supply (Buyer’s Market) and a Sales to Listings Ratio of 34% compared to 35% in March 2019.

Ladner: Total Units Sold in April 2019 was 29 – up from 25 (16%) in March 2019, down from 32 (9%) in April 2018, down from 46 (37%) in April 2017; Active Listings are at 190 compared to 129 at this time last year (up 47%); New Listings in April 2019 were down 16% compared to March 2019; were up 14% compared to April 2018 and up 14% compared to April 2017; Month’s Supply of Total Residential Listings is steady at 7 Month’s Supply (Buyer’s Market) and a Sales to Listings Ratio of 45% compared to 32% in March 2019.

Tsawwassen: Total Units Sold in April 2019 was 18 – up from 15 (20%) in March 2019, down from 38 (53%) in April 2018, down from 41 (56%) in April 2017; Active Listings are at 296 compared to 243 at this time last year (up 22%); New Listings in April 2019 were up 28% compared to March 2019; were down 7% compared to April 2018 and up 54% compared to April 2017; Month’s Supply of Total Residential Listings is steady at 16 Month’s Supply (Buyer’s Market) and a Sales to Listings Ratio of 17% compared to 18% in March 2019.

Pitt Meadows: Total Units Sold in April 2019 was 28 – up from 24 (31%) in March 2019, up from 25 (12%) in April 2018, down from 56 (50%) in April 2017; Active Listings are at 136 compared to 72 at this time last year (up 89%); New Listings in April 2019 were up 28% compared to March 2019; were up 24% compared to April 2018 and down 11% compared to April 2017; Month’s Supply of Total Residential Listings is steady at 5 Month’s Supply (Balanced Market) and a Sales to Listings Ratio of 38% compared to 43% in March 2019.

Maple Ridge: Total Units Sold in April 2019 was 124 – up from 15 (20%) in March 2019, down from 205 (39%) in April 2018, down from 205 (60%) in April 2017; Active Listings are at 792 compared to 512 at this time last year (up 56%); New Listings in April 2019 were up 31% compared to March 2019; were down 5% compared to April 2018 and up 23% compared to April 2017; Month’s Supply of Total Residential Listings is steady at 6 Month’s Supply (Buyer’s Market) and a Sales to Listings Ratio of 36% compared to 44% in March 2019.


Kevin Skipworth
DEXTER REALTY - Managing Broker/Partner


Read

Sales and Listings Report for April 15, 2019 and Monday Morning Meeting update

Sales and listings stats are attached as of April 15, 2019. April sales volumes are similar to that of March and down from April of last year. But the number of listings on market has increased and signs of the number of new listings in April are higher than last year and March of this year. With the number of new listings higher this month, the sales to listings ratio did drop from March so far, but that is likely to change by the end of the month with sales volumes increasing as the month goes on. Here is a summary of the activity so far:

Greater Vancouver: 856 Units Sold so far in April 2019 compared to 1,143 Units Sold as of April 15, 2018 and 864 Units Sold as of March 15, 2019. Total New Listings so far in April 2019 are 2,890 compared to 2,785 at the same time in April 2018 and 2,708 as of March 15, 2019. Total Active Listings are at 14,230 (9,723 at the same time last year). Sales To Listings Ratio is at 30% compared to 32% in March 2019.

Vancouver West: 154 Units Sold so far in April 2019 compared to 219 Units Sold as of April 15, 2018 and 176 Units Sold as of March 15, 2019. Total New Listings so far in April 2019 are 568 compared to 594 at the same time in April 2018 and 564 as of March 15, 2019. Total Active Listings are at 2,648 (1,862 at the same time last year). Sales To Listings Ratio is at 27% compared to 31% in March 2019.

Vancouver East: 94 Units Sold so far in April 2019 compared to 130 Units Sold as of April 15, 2018 and 176 Units Sold as of March 15, 2019. Total New Listings so far in April 2019 are 301 compared to 329 at the same time in April 2018 and 261 as of March 15, 2019. Total Active Listings are at 1,335 (1,114 at the same time last year). Sales To Listings Ratio is at 31% compared to 34% in March 2019.

North Vancouver: 71 Units Sold so far in April 2019 compared to 92 Units Sold as of April 15, 2018 and 78 Units Sold as of March 15, 2019. Total New Listings so far in April 2018 are 273 compared to 235 at the same time in April 2018 and 214 as of March 15, 2019. Total Active Listings are at 989 (596 at the same time last year). Sales To Listings Ratio is at 26% compared to 36% in March 2019

West Vancouver: 27 Units Sold so far in April 2019 compared to 22 Units Sold as of April 15, 2018 and 17 Units Sold as of March 15, 2019. Total New Listings so far in April 2019 are 119 compared to 128 at the same time in April 2018 and 104 as of March 15, 2019. Total Active Listings are at 695 (608 at the same time last year). Sales To Listings Ratio is at 23% compared to 16% in March 2019.

Richmond: 80 Units Sold so far in April 2019 compared to 146 Units Sold as of April 15, 2018 and 94 Units Sold as of March 15, 2019. Total New Listings so far in April 2019 are 367 compared to 317 at the same time in April 2018 and 365 as of March 15, 2019. Total Active Listings are at 2,144 (1,408 at the same time last year). Sales To Listings Ratio is at 22% compared to 26% in March 2019.

Kevin Skipworth

Dexter Realty

Owner Partner/Managing Broker

#mondaymorningmeeting
At the Dexter Realty #southgranville offices in #vancouver
#realestate 
#greaterVancouver
#realestatemarket

With the implementation of mortgage stress test since Jan 1, 2018, it has created a strong buyer market . With the recent government intervention and mortgage stress test, the sales volume has significant decreased. But from a long history of real estate market in Vancouver , it’s been quite resilient . They have been various cycles through the years, but it has been a positive long term investment .

Market update
- Sales in March is better than February and Sales in February is better than January 2019.
- overall sales in 1st 2 weeks of April is 50% more than 1st 2 weeks of March 2019

The statistics showed that we have about 1700 sales by March. 13,400 listing in the market place currently and Vancouver Westside activities has really picked up in March compared to the first 2 months of 2019. The single detach house remains 11 months supply which is still a buyer market & the Westside condo market is around 6 months supply which is a balanced market. This is the 1st sign of a turning spring market.

These are all signs for a strong Spring Market. 
If you are looking to get into the market or move up to a larger home, this is a great opportunity let’s meet and talk about it.

PROFESSIONAL ADVICE
From Carolynne Maguire - BC Notary.

End of April is fast approaching and tax filing due date is coming soon! If you purchased your very first home as a first-time buyer in 2018, you might be qualify for income tax credit when you file your income tax - that means possibly Free Money.
If you know someone who is a first time buyer & purchased a home in 2018, 
Call us for more information !

#MortgageUpdate 
Family Equity Program - a great way for parents to provide a protected down payment gift to their children in helping them with their home purchase while the parents’ gift is protected . If you are wanting to learn more about this, please let us know !

#CurrentInterestRate 
Current 5 Year Bond rate went up slightly.

⭐ Fix rate special 3.39% for high-ratio mortgage, $478/month of mortgage payment for every $100,000 borrowed

⭐ High-ratio mortgage rate -3.14%which is around $481/month of mortgage payment with 25 years amortization for every $100,000 borrowed or $451/ month of mortgage payment for 30 years amortization length.

⭐ Conventional rate - 3.24% which is around $435/month of mortgage payment for every $100,000 borrower with 30 years amortization period

⭐ Variable rate - 2.95% which is about $471/Month of mortgage payment for $100,000 you borrow with 25 years of amortization period or $418/month of mortgage payment for 30 years of amortization period

We are at 35 years low in mortgage growth as a result of the implementations of mortgage stress test from one year ago.

Rate has been holding fairly steady and there are a good supply of housing options on the market.

#lovewhereyoulive 
#lovewhatyoudo

Have a Fantastic week!

www.conniemcginley.ca

Graph from January 1977 to March 2019

Photo of: David Peerless - Dexter Realty - Owner President/Managing Broker

Contact me for a copy of it.

Read

Attached are the Sales and Listings Stats updated to the end of March 2019. Ok, next! Let’s just move on to April! But for those looking for a recap, there were 1,743 sales in Greater Vancouver in March 2019, the lowest total for the month of March since 1986. So here is what we know; it was a slow month for home sales, buyers and sellers are both hesitant in the market, The Federal Government announced their budget in March and provided little in the way of benefits to buyers in our market area and now we see fixed interest rates coming down. Here’s what we don’t know; while fixed rates are falling, how far will they fall, will there be federal election promises to boost the housing market prior to October’s election, where will the inventory of resale homes go after moderately increasing in a slower market for sales. And what don’t we know: how many buyers and sellers are waiting eagerly on the sidelines to make a move – pent up demand is growing! And policy changes can only keep that demand down for so long.

The 1,743 homes sold in Greater Vancouver in March were up from 1,512 (15%) from February this year. This was compared with 2,551 sales (down 35%) in March last year and 3,632 sales in March 2017. This was 45 per cent below the 10-year average for March. In looking around Greater Vancouver, both Vancouver’s Westside and North Vancouver saw the most significant increases in sales month over month at 33 per cent and 35 per cent respectively. While West Vancouver, Port Coquitlam and Tsawwassen had sales in March lower than February. In Burnaby East there were zero detached house sales in March. Regional markets are different in their make up and activity, but we typically see Vancouver be a leading indicator in the market. So again, let’s move into April.

On the other side of the equation, there were 5,057 new listings in March in Greater Vancouver, up from 4,557 in March last year and up from 3,974 in February 2019. The number of new listings in March were 12 per cent below the 10-year average for March. There are currently 13,408 Active Listings on the market in Greater Vancouver – up from 9,037 at the end of March last year. While Active Listings are up 48 per cent, they are still relatively low compared to previous markets with similar activity. In 1998 there were 1,921 sales in March with 19,488 Active Listings and in 2013 there were 2,373 sales with 16,322 Active Listings. The lack of inventory is still keeping buyers at bay in some areas. In Vancouver’s Westside the amount of detached homes for sale decreased in March to 694 from 713 in February, an unusual trend for a spring market.

“Housing demand today isn’t aligning with our growing economy and low unemployment rates. The market trends we’re seeing are largely policy induced,” Ashley Smith, Real Estate Board of Greater Vancouver president said. “For three years, governments at all levels have imposed new taxes and borrowing requirements on the housing market. What policymakers are failing to recognize is that demand-side measures don’t eliminate demand, they sideline potential home buyers in the short term. That demand is ultimately satisfied down the line because shelter needs don’t go away. Using public policy to delay local demand in the housing market just feeds disruptive cycles that have been so well-documented in our region.”

The Fraser Valley Real Estate Board processed 1,221 sales of all property types on its MLS® in March, a 24.3 per cent increase compared to sales in February 2019, and a 26.6 per cent decrease compared to the 1,664 sales in March of last year. Of the 1,221 total sales, 462 were residential detached homes, 300 were townhouses, and 346 apartments. This was the lowest sales total for the Board for March since 2013. Darin Germyn, President of the Fraser Valley Real Estate Board, said “From a buyer’s perspective, there are more opportunities available as we move deeper into spring. Many of our communities are seeing higher inventory levels, especially in the attached market with the number of available townhomes almost doubling and Fraser Valley condos more than doubling compared to last year.”

Here’s a summary of the numbers:

Greater Vancouver: Total Units Sold in March 2019 was 1,745 – up from 1,512  (15%) in February 2019, down from 2,551 (32%) in March 2018, down from 3,632 (52%) in March 2017; Active Listings are at 13,408 compared to 9,037 at this time last year; New Listings in March 2019 were up 27% compared to February 2019; were up 10% compared to March 2018 and up 3% compared to March 2017; Month’s Supply of Total Residential Listings is steady at 8 Month’s Supply (Buyer’s Market) and a Sales to Listings Ratio of 35% compared to 38% in February 2019.

Vancouver Westside Residential: Total Units Sold in March 2019 was 333 – up from 254  (31%) in February 2019, down from 441 (24%) in March 2018, down from 616 (38%) in March 2017; Active Listings are at 2,511 compared to 1,691 at this time last year; New Listings in March 2019 were up 12% compared to February 2019; were up 11% compared to March 2018 and up 20% compared to March 2017; Month’s Supply of Total Residential Listings is down to 8 Month’s Supply (Buyer’s Market) and a Sales to Listings Ratio of 34% compared to 29% in February 2019.

Vancouver Eastside Residential: Total Units Sold in March 2019 was 174 – up from 166  (5%) in February 2019, down from 284 (39%) in March 2018, down from 384 (55%) in March 2017; Active Listings are at 1,239 compared to 1,043 at this time last year; New Listings in March 2019 were up 32% compared to February 2019; were the same compared to March 2018 and down 3% compared to March 2017; Month’s Supply of Total Residential Listings is steady at 7 Month’s Supply (Buyer’s Market) and a Sales to Listings Ratio of 34% compared to 43% in February 2019.

North Vancouver Residential: Total Units Sold in March 2019 was 165 – up from 124  (33%) in February 2019, down from 216 (24%) in March 2018, down from 261 (37%) in March 2017; Active Listings are at 883 compared to 516 at this time last year; New Listings in March 2019 were up 16% compared to February 2019; were up 8% compared to March 2018 and up 14% compared to March 2017; Month’s Supply of Total Residential Listings is down to 5 Month’s Supply (Balanced Market) and a Sales to Listings Ratio of 42% compared to 37% in February 2019.

West Vancouver Houses: Total Units Sold in March 2019 was 34 – up from 39  (13%) in February 2019, down from 42 (19%) in March 2018, down from 97 (65%) in March 2017; Active Listings are at 670 compared to 585 at this time last year; New Listings in March 2019 were down 1% compared to February 2019; were up 9% compared to March 2018 and down 20% compared to March 2017; Month’s Supply of Total Residential Listings is up to 20 Month’s Supply (Buyer’s Market) and a Sales to Listings Ratio of 20% compared to 23% in February 2019.

Richmond Residential: Total Units Sold in March 2019 was 178 – up from 155  (15%) in February 2019, down from 306 (42%) in March 2018, down from 537 (67%) in March 2017; Active Listings are at 2,025 compared to 1,379 at this time last year; New Listings in March 2019 were up 42% compared to February 2019; were up 10% compared to March 2018 and down 1% compared to March 2017; Month’s Supply of Total Residential Listings is down to 11 Month’s Supply (Buyer’s Market) and a Sales to Listings Ratio of 26% compared to 33% in February 2019.

Burnaby East: Total Units Sold in March 2019 was 17 – the same as in February 2019, down from 26 (35%) in March 2018, down from 53 (68%) in March 2017; Active Listings are at 141 compared to 123 at this time last year; New Listings in March 2019 were up 42% compared to February 2019; were up 24% compared to March 2018 and down 20% compared to March 2017; Month’s Supply of Total Residential Listings is up to 8 Month’s Supply (Buyer’s Market) and a Sales to Listings Ratio of 33% compared to 47% in February 2019.

Burnaby North: Total Units Sold in March 2019 was 77 – down from 84 (8%) in February 2019, down from 131 (41%) in March 2018, down from 170 (55%) in March 2017; Active Listings are at 536 compared to 314 at this time last year; New Listings in March 2019 were up 40% compared to February 2019; were up 4% compared to March 2018 and down 6% compared to March 2017; Month’s Supply of Total Residential Listings is up to 7 Month’s Supply (Buyer’s Market) and a Sales to Listings Ratio of 34% compared to 53% in February 2019.

Burnaby South: Total Units Sold in March 2019 was 97 – up from 83  (17%) in February 2019, down from 103 (6%) in March 2018, down from 167 (42%) in March 2017; Active Listings are at 771 compared to 390 at this time last year; New Listings in March 2019 were up 40% compared to February 2019; were up 48% compared to March 2018 and up 29% compared to March 2017; Month’s Supply of Total Residential Listings is steady at 8 Month’s Supply (Buyer’s Market) and a Sales to Listings Ratio of 33% compared to 40% in February 2019.

New Westminster: Total Units Sold in March 2019 was 81 – up from 63 (29%) in February 2019, down from 149 (46%) in March 2018, down from 166 (51%) in March 2017; Active Listings are at 472 compared to 224 at this time last year; New Listings in March 2019 were up 24% compared to February 2019; were up 5% compared to March 2018 and down 1% compared to March 2017; Month’s Supply of Total Residential Listings is down to 6 Month’s Supply (Buyer’s Market) and a Sales to Listings Ratio of 40% compared to 38% in February 2019.

Coquitlam: Total Units Sold in March 2019 was 142 – up from 134 (6%) in February 2019, down from 204 (30%) in March 2018, down from 303 (53%) in March 2017; Active Listings are at 933 compared to 552 at this time last year; New Listings in March 2019 were up 42% compared to February 2019; were up 27% compared to March 2018 and up 9% compared to March 2017; Month’s Supply of Total Residential Listings is up to 7 Month’s Supply (Buyer’s Market) and a Sales to Listings Ratio of 35% compared to 46% in February 2019.

Port Moody: Total Units Sold in March 2019 was 38 – up from 30 (27%) in February 2019, down from 57 (33%) in March 2018, down from 83 (54%) in March 2017; Active Listings are at 210 compared to 131 at this time last year; New Listings in March 2019 were up 19% compared to February 2019; were up 22% compared to March 2018 and the same compared to March 2017; Month’s Supply of Total Residential Listings is steady at 6 Month’s Supply (Balanced Market) and a Sales to Listings Ratio of 40% compared to 38% in February 2019.

Port Coquitlam: Total Units Sold in March 2019 was 59 – down from 60 (1%) in February 2019, down from 103 (43%) in March 2018, down from 139 (58%) in March 2017; Active Listings are at 343 compared to 160 at this time last year; New Listings in March 2019 were up 19% compared to February 2019; were up 34% compared to March 2018 and down 6% compared to March 2017; Month’s Supply of Total Residential Listings is up to 6 Month’s Supply (Balanced Market) and a Sales to Listings Ratio of 35% compared to 43% in February 2019.

Ladner: Total Units Sold in March 2019 was 25 – up from 20 (25%) in February 2019, up from 24 (3%) in March 2018, down from 45 (44%) in March 2017; Active Listings are at 170 compared to 126 at this time last year; New Listings in March 2019 were up 54% compared to February 2019; were up 40% compared to March 2018 and up 4% compared to March 2017; Month’s Supply of Total Residential Listings is steady at 7 Month’s Supply (Buyer’s Market) and a Sales to Listings Ratio of 32% compared to 40% in February 2019.

Tsawwassen: Total Units Sold in March 2019 was 15 – down from 21 (29%) in February 2019, down from 39 (62%) in March 2018, down from 58 (74%) in March 2017; Active Listings are at 236 compared to 194 at this time last year; New Listings in March 2019 were up 55% compared to February 2019; were up 2% compared to March 2018 and up 16% compared to March 2017; Month’s Supply of Total Residential Listings is up to 16 Month’s Supply (Buyer’s Market) and a Sales to Listings Ratio of 18% compared to 38% in February 2019.

Pitt Meadows: Total Units Sold in March 2019 was 24 – the same as February 2019, down from 34 (29%) in March 2018, down from 44 (45%) in March 2017; Active Listings are at 119 compared to 52 at this time last year; New Listings in March 2019 were up 34% compared to February 2019; were up 61% compared to March 2018 and down 17% compared to March 2017; Month’s Supply of Total Residential Listings is down to 5 Month’s Supply (Balanced Market) and a Sales to Listings Ratio of 43% compared to 36% in February 2019.

Maple Ridge: Total Units Sold in March 2019 was 116 – up from 100 (16%) in February 2019, down from 180 (35%) in March 2018, down from 262 (56%) in March 2017; Active Listings are at 675 compared to 422 at this time last year; New Listings in March 2019 were up 26% compared to February 2019; down 8% compared to March 2018 and down 17% compared to March 2017; Month’s Supply of Total Residential Listings is up to 6 Month’s Supply (Balanced Market) and a Sales to Listings Ratio of 44% compared to 48% in February 2019.

Kevin Skipworth

Dexter Realty

Broker/Owner

Read