Attached are the Sales and Listings Stats updated to the end of July 2019. It’s down, it’s up, it’s down, it’s up… We wouldn’t expect anything less from the Metro Vancouver real estate market. After a lack lustre June, home sales in July were higher than both June of this year and July last year. A noticeable increase in demand for homes in July, a month that typically sees buyers taking a break from the market. And looking at the number of new listings that came on, sellers may have been the ones taking a break from the market. I hate to say I told you so, but active listings did their best to climb above 15,000 and have now dropped below. Supply isn’t an issue? Only if we don’t want don’t want to keep home prices in check.
There were 2,584 homes sold of all types in Greater Vancouver in July this year compared with 2,098 homes sold last month, 2,018 sales in July last year and 3,012 homes sold in July 2017. This was 8 per cent below the 10-year average for July (compared with 33 per cent below the 10-year average last year in July). It was still the lowest number of homes sold in July since 2012 at 2,135. In fact, 1998 to 2000 saw some of the lowest amounts for sales in the month of July (1,758 in 2000, 2,217 in 1999 and 1,860 in 1998). Considering the commentary of it being a down real estate market, this month showed that buyers are engaging. There were 841 detached houses sold in July 2019 up from 637 (32 per cent) in June in Greater Vancouver, with a 10.5 per cent decrease in the benchmark price of these homes year over year. For townhouses there were 473 sales in July 2019 compared to 354 in July 2018 (up 33.6 per cent) with a 9 per cent decrease in the benchmark price year over year; and for condos there were 1,243 sales in July, an increase in sales from 1,079 in July 2018 (up 15.2 per cent) with an 8.8 per cent decrease in the benchmark price year over year. Buyers are taking advantage of the opportunity to move up and buy into the townhouse and detached home market with their price decreases in the last 2 years.
As for the supply homes in Greater Vancouver, there was a decrease in the number of new listings in July compared to last month and July of last year. There were 4,719 new listings during July in Greater Vancouver, down 3 per cent from July last year and down 12 per cent from July 2017. The number of new listings in July 2019 were 6 per cent below the 10-year average for the month of July. Active Listings are at 15,037 for month end (up 17 per cent compared to July 2018) and after listing expiries at month’s end, there were only 14,469 active listings at the start of August. This was a much more significant drop in listings after July than we’ve seen after the through the month of July in the last 10 years. Over the last 25 years the number of new listings in the last 6 months of the year has been 30 to 35 per cent less than the number of new listings in the first half of the year – so expect the active listing count to drop further and buyers will need to act sooner rather than later to take advantage of buyer market conditions.
The mix of supply currently has 10,000 active listings priced at $1M are more – leaving less than 4,700 active listings priced below $1M in Greater Vancouver. Looking at 13,576 sales in the first 7 months of 2019, there have been only 347 sales above $3M; 672 sales between $2m to $3M; 3,382 sales between $1M to $2M and 9,018 sales below $1M. The competition is clearly in the least suppled range of homes, yet this is not the focus of policy for all levels of government. The provincial government is intent on focusing policy on the least active segment of the market by trying to control that demand. Which begs the question, how are they making housing more affordable by not focusing on the supply of the lower end of the market?
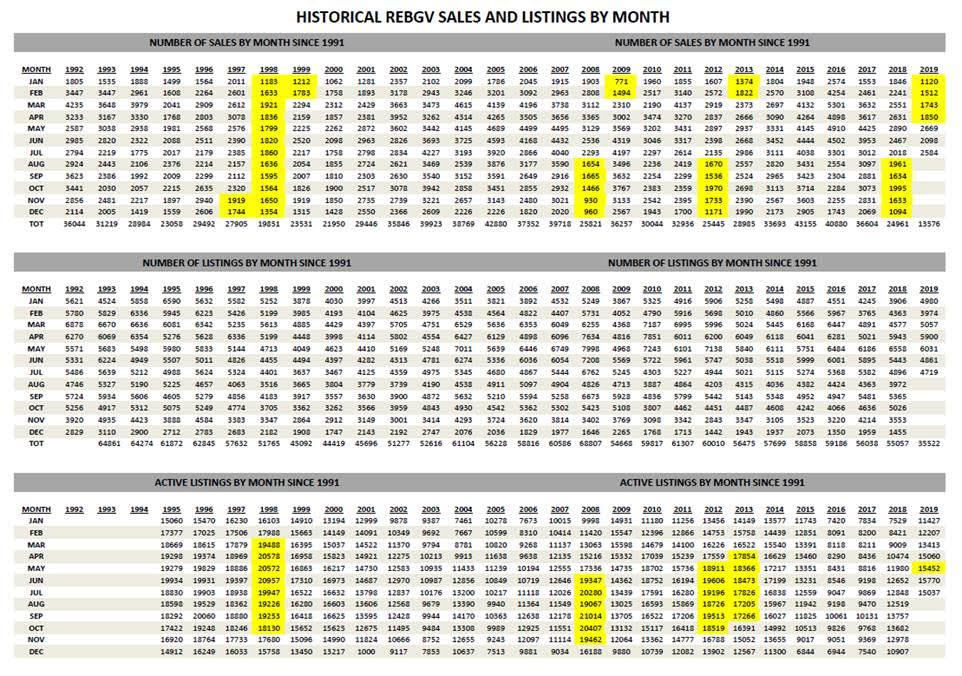
Below is the historical month by month data in Greater Vancouver going back to the early 90’s showing sales, new listings and active listings. The yellow highlighted areas for sales show the slowest months of the market and for active listings, the highest number of active listings we’ve seen in the market. Clearly this latest slowdown in the real estate market saw one of the more prolonged decrease in sales but the least number of active listings for a down market. Sellers are confident and the idea of a significant drop in values won’t happen with that confidence.
“While home sale activity remains below long-term averages, we saw an increase in sales in July compared to the less active spring we experienced,” Ashely Smith, Real Estate Board of Greater Vancouver president said. “Those looking to buy today continue to benefit from the low interest rates, increased selection, and reduced prices compared to the heated market a few years ago.”
East of the Fraser River, the Fraser Valley Real Estate Board processed 1,458 sales of all property types on its Multiple Listing Service® in July, an increase of 11.6 per cent compared to sales in June and a 13 per cent increase compared to the 1,290 sales in July of last year. Active listings for the Fraser Valley finished at 8,340, decreasing 2.1 per cent month-over-month and an increase of 12.7 per cent when compared to July 2018. There were 2,797 new listings in July, a 0.5 per cent decrease compared to June 2019 and a 4.2 per cent decrease compared to July 2018. “We’ve been expecting market improvement, but didn’t quite anticipate July’s momentum. We’ve gone from the worst June in almost 20 years to a July that’s only slightly below the 10-year average,” said Chris Shields, President-Elect of the Fraser Valley Real Estate Board. “We attribute the change in July to pent-up demand and an increase in consumer confidence. REALTORS® in our market saw more activity at open houses, and an increase in the number of first-time buyers.”
Here’s a summary of the numbers:
Greater Vancouver: Total Units Sold in July 2019 was 2,584 – up from 2,098 (23%) in June 2019, up from 2,108 (23%) in July 2018, down from 3,012 (14%) in July 2017; Active Listings are at 15,037 compared to 12,848 (up 17%) at this time last year; New Listings in July 2019 were down 3% compared to July 2018 and down 12% compared to July 2017; Month’s Supply of Total Residential Listings down to 6 Month’s Supply (Balanced to Buyer’s Market conditions in some areas and product types and price range) and a Sales to Listings Ratio of 55% compared to 43% in July 2018.
Vancouver Westside Residential: Total Units Sold in July 2019 was 489 – up from 355 (38%) in June 2019, up from 403 (21%) in July 2018, down from 525 (7%) in July 2017; Active Listings are at 2,572 compared to 2,272 (up 13%) at this time last year; New Listings in July 2019 were up 0.5% compared to July 2018 and down 10% compared to July 2017; Month’s Supply of Total Residential Listings down to 5 Month’s Supply (Balanced Market with higher end homes in Buyer’s Market Conditions) and a Sales to Listings Ratio of 55% compared to 45 in July 2018.
Vancouver Eastside Residential: Total Units Sold in July 2019 was 277 – up from 215 (29%) in June 2019, down from 282 (2%) in July 2018, down from 307 (10%) in July 2017; Active Listings are at 1,341 compared to 1,391 (down 4%) at this time last year; New Listings in July 2019 were down 13% compared to July 2018 and down 13% compared to July 2017; Month’s Supply of Total Residential Listings down to 5 Month’s Supply (Balanced Market) and a Sales to Listings Ratio of 59% compared to 42% in July 2018.
North Vancouver Residential: Total Units Sold in July 2019 was 205 – up from 202 (1%) in June 2019, up from 153 (34%) in July 2018, up from 200 (3%) in July 2017; Active Listings are at 949 compared to 794 (up 20%) at this time last year; New Listings in July 2019 were up 12% compared to July 2018 and up 1% compared to July 2017; Month’s Supply of Total Residential Listings is steady at Month’s Supply (Balanced Market) and a Sales to Listings Ratio of 56% compared to 47% in July 2018.
West Vancouver Houses: Total Units Sold in July 2019 was 59 – up from 43 (37%) in June 2019, up from 57 (4%) in July 2018, up from 56 (5%) in July 2017; Active Listings are at 726 compared to 740 (down 2%) at this time last year; New Listings in July 2019 were down 13% compared to July 2018 and down 13% compared to July 2017; Month’s Supply of Total Residential Listings down to 12 Month’s Supply (Buyer’s Market) and a Sales to Listings Ratio of 39% compared to 33% in July 2018.
Richmond Residential: Total Units Sold in July 2019 was 301 – up from 270 (11%) in June 2019, up from 284 (6%) in July 2018, down from 404 (25%) in July 2017; Active Listings are at 2,309 compared to 1,809 (up 28%) at this time last year; New Listings in July 2019 were down 4% compared to July 2018 and down 24% compared to July 2017; Month’s Supply of Total Residential Listings down to 8 Month’s Supply (Buyer’s Market) and a Sales to Listings Ratio of 49% compared to 44% in July 2018.
Burnaby East: Total Units Sold in July 2019 was 14 – down from 19 (23%) in June 2019, down from 21 (23%) in July 2018, down from 31 (14%) in July 2017; Active Listings are at 166 compared to 138 (up 17%) at this time last year; New Listings in July 2019 were down 18% compared to July 2018 and down 25% compared to July 2017; Month’s Supply of Total Residential Listings up to 12 Month’s Supply (Buyer’s Market) and a Sales to Listings Ratio of 31% compared to 38% in July 2018.
Burnaby North: Total Units Sold in July 2019 was 132 – up from 100 (32%) in June 2019, up from 88 (50%) in July 2018, up from 124 (6%) in July 2017; Active Listings are at 630 compared to 476 (up 32%) at this time last year; New Listings in July 2019 were up 12% compared to July 2018 and down 6% compared to July 2017; Month’s Supply of Total Residential Listings down to 5 Month’s Supply (Balanced Market) and a Sales to Listings Ratio of 56% compared to 42% in July 2018.
Burnaby South: Total Units Sold in July 2019 was 152 – up from 121 (26%) in June 2019, up from 76 (23%) in July 2018, down from 144 (14%) in July 2017; Active Listings are at 807 compared to 646 (up 100%) at this time last year; New Listings in July 2019 were down 8% compared to July 2018 and down 23% compared to July 2017; Month’s Supply of Total Residential Listings down to 5 Month’s Supply (Balanced Market) and a Sales to Listings Ratio of 64% compared to 29% in July 2018.
New Westminster: Total Units Sold in July 2019 was 122 – up from 97 (26%) in June 2019, up from 114 (7%) in July 2018, down from 150 (19%) in July 2017; Active Listings are at 533 compared to 385 (up 38%) at this time last year; New Listings in July 2019 were down 3% compared to July 2018 and down 12% compared to July 2017; Month’s Supply of Total Residential Listings down to 4 Month’s Supply (Balanced Market) and a Sales to Listings Ratio of 61% compared to 55% in July 2018.
Coquitlam: Total Units Sold in July 2019 was 236 – up from 177 (33%) in June 2019, up from 150 (57%) in July 2018, down from 270 (13%) in July 2017; Active Listings are at 1,120 compared to 979 (up 14%) at this time last year; New Listings in July 2019 were down 6% compared to July 2018 and down 6% compared to July 2017; Month’s Supply of Total Residential Listings down to 5 Month’s Supply (Balanced Market) and a Sales to Listings Ratio of 54% compared to 32% in July 2018.
Port Moody: Total Units Sold in July 2019 was 56 – up from 42 (23%) in June 2019, up from 52 (23%) in July 2018, down from 75 (14%) in July 2017; Active Listings are at 236 compared to 218 (up 17%) at this time last year; New Listings in July 2019 were down 31% compared to July 2018 and down 37% compared to July 2017; Month’s Supply of Total Residential Listings down to 4 Month’s Supply (Balanced Market) and a Sales to Listings Ratio of 75 compared to 48% in July 2018.
Port Coquitlam: Total Units Sold in July 2019 was 86 – up from 77 (12%) in June 2019, down from 108 (20%) in July 2018, down from 120 (38%) in July 2017; Active Listings are at 381 compared to 330 (up 15%) at this time last year; New Listings in July 2019 were down 3% compared to July 2018 and down 12% compared to July 2017; Month’s Supply of Total Residential Listings down to 4 Month’s Supply (Balanced Market) and a Sales to Listings Ratio of 57% compared to 45% in July 2018.
Ladner: Total Units Sold in July 2019 was 34 – up from 33 (3%) in June 2019, up from 29 (17%) in July 2018, down from 46 (26%) in July 2017; Active Listings are at 190 compared to 164 (up 16%) at this time last year; New Listings in July 2019 were up 34% compared to July 2018 and up 9% compared to July 2017; Month’s Supply of Total Residential Listings steady at 6 Month’s Supply (Balanced to Buyer’s Market conditions in some areas and product types and price range) and a Sales to Listings Ratio of 58% compared to 66% in July 2018.
Tsawwassen: Total Units Sold in July 2019 was 46 – up from 35 (31%) in June 2019, up from 23 (100%) in July 2018, up from 43 (7%) in July 2017; Active Listings are at 287 compared to 253 (up 13%) at this time last year; New Listings in July 2019 were up 15% compared to July 2018 and down 7% compared to July 2017; Month’s Supply of Total Residential Listings down to 6 Month’s Supply (Balanced to Buyer’s Market) and a Sales to Listings Ratio of 65% compared to 37% in July 2018.
Pitt Meadows: Total Units Sold in July 2019 was 20 – down from 24 (17%) in June 2019, down from 25 (20%) in July 2018, down from 25 (20%) in July 2017; Active Listings are at 139 compared to 109 (up 28%) at this time last year; New Listings in July 2019 were down 3% compared to July 2018 and up 12% compared to July 2017; Month’s Supply of Total Residential Listings down to 7 Month’s Supply (Balanced to Buyer’s Market) and a Sales to Listings Ratio of 40% compared to 48% in July 2018.
Maple Ridge: Total Units Sold in July 2019 was 182 – up from 132 (38%) in June 2019, up from 130 (40%) in July 2018, down from 213 (15%) in July 2017; Active Listings are at 870 compared to 614 (up 35%) at this time last year; New Listings in July 2019 were up 18% compared to July 2018 and up 2% compared to July 2017; Month’s Supply of Total Residential Listings is steady at 5 Month’s Supply (Balanced Market) and a Sales to Listings Ratio of 56% compared to 47% in July 2018.