
Average is the new up! Vancouver prices have gone up and will rise even more. What seemed like a very exuberant real estate market in Greater Vancouver in February produced an average volume of sales. With multiple offers a consistent theme, less so with detached homes, one would think it was a record month for total number of sales – especially with 42 offers on a house in Kitsilano. But funny, that supply and demand equation still rings true, when there isn’t enough supply to meet the demand, prices shift up and competition occurs.
British Columbia’s finance minister said that she is cautiously optimistic that real estate will become affordable for the average citizen over the next year, even though demand is expected to keep eclipsing supply. Think about that for a second. The number of buyers is increasing more than the number of sellers. What happens when there is scarcity of something? people compete for that item. Greater Vancouver’s real estate market is seeing the number of homes available dwindle to a level not seen in over two years in all property types and a spring market is emerging that has buyers wanting what there isn’t enough of – housing. And these are very much local buyers. This is most evident in the apartment and townhome segment of the market under $1,000,000. Since January 1st, in Downtown Vancouver there have been 89 MLS® sales reported – 43 of which sold at list price or above. There have been 18 townhouse sales on Vancouver’s Westside since January 1st and 9 of those sold at list or above. What happens when apartment buyers can’t find townhomes to buy? They don’t sell and there are less apartments in lower price ranges available. But what’s really telling in this market is that while the number of home sales are just below the 10-year average; prices are rising… incidents of 18 offers, 25 offers, 68 offers on listed properties are occurring. What part of that signal’s affordability?
There were 2,185 homes sold of all types in Greater Vancouver in February this year compared with 1,602 homes sold last month, 1,512 sales in February last year and 2,241 homes sold in February 2018. Sales in February were 17 per cent below the 10-year average for the month of February but only 7 per cent below the 10-year average if the 4,254 sales from February 2016 were excluded – an all-time record amount of sales for that month. The number of sales in February were 45 per cent higher compared to February 2019, continuing the trend for the eighth straight month where year-over-year sales were up. Yes, home sales are up but they are still reaching for the average. Imagine what could happen to prices once buyers engage even more, and the number of homes for sale continues to decline.
Some highlights from February:
The number of sales in Richmond in January were only up 11% compared to January of last year with townhouses once again leading the way, up 103% year over year – the number of new listings in Richmond for all property types were down year over year
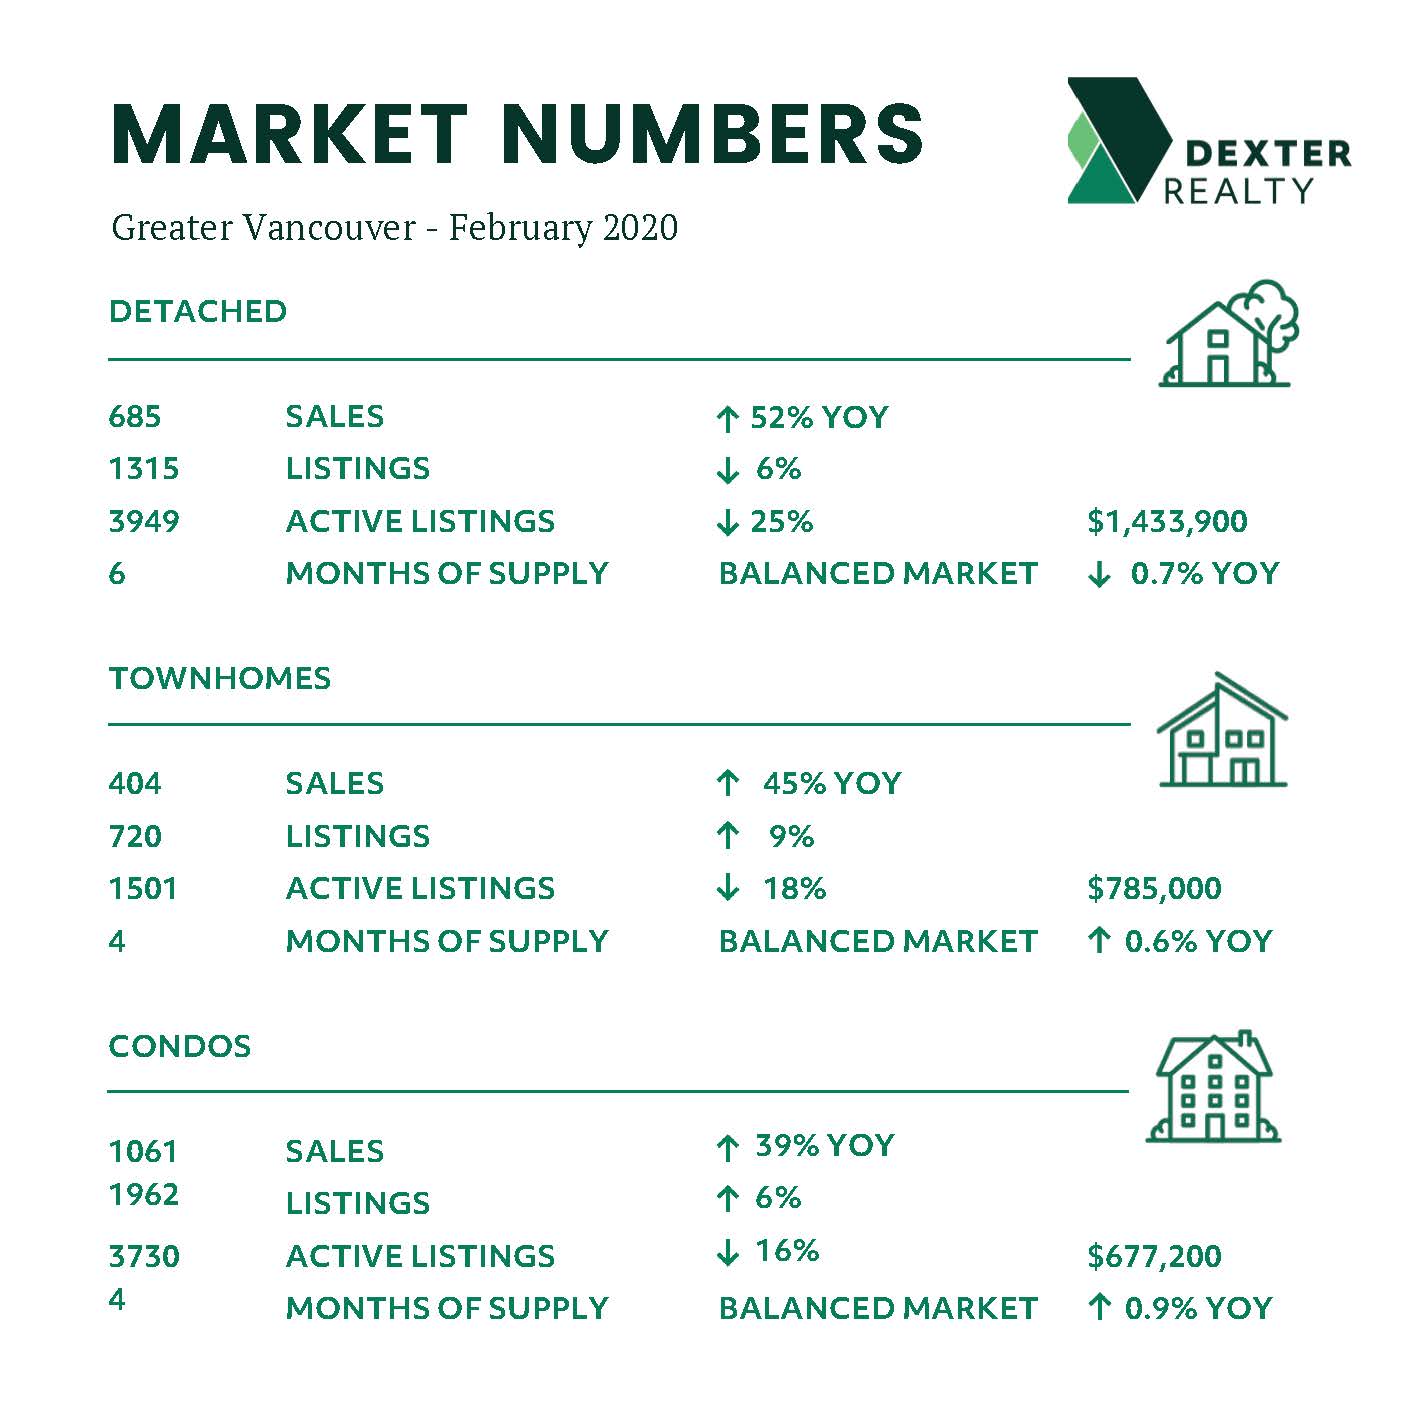
The number of detached homes currently listed in Vancouver continues to decline – with 517 Westside houses available at the end of February – which is lower than the end of January and 27% fewer than February 2019; on the East Side there are 36% less houses available compared to February 2019 with sales of detached houses up 59% year over year
Average prices for townhouses and condos in the majority of areas in Greater Vancouver increased significantly in February as buyers competed much more for these types of properties (Average prices are a calculation based on the total dollar volume of sales and the number of homes sold)
Detached homes showed higher year over year gains in the number of homes sold compared to townhouses and apartments in most areas as buyers continue to take advantage of the closer gap between the price of detached homes and attached properties
There have been 47 sales of homes under $3,000,000 on Vancouver’s Westside since January 1st and 16 of them have sold at list price or above
The number of homes for sale in Greater Vancouver saw limited growth in February, with a similar number of new listings for the month of February over the last three years. At the end of February there were 9,894 homes for sale in Greater Vancouver, compared to 9,307 at the end of January and 12,207 at the end of February 2019. This limited number of homes for sale is producing more multiple offers than we’ve seen in the last few years and is pushing prices up in some areas and product types. There were 4,101 new listings during February in Greater Vancouver, up 3 per cent from February last year. The number of new listings in February were 17 per cent below the 10-year average for the month of February. And with reports that there are significantly less new developments that will be coming out over the next few years, the supply of homes available to purchase will cause prices to rise. Again, what part of that signal’s affordability?
“Home buyer demand again saw string year-over-year increases in February while the total inventory of homes for sale struggled to keep pace,” Ashely Smith, Real Estate Board of Greater Vancouver president said. “This was most pronounced in the condominium market.”
East of the Fraser River, the Fraser Valley Real Estate Board processed 1,352 sales of all property types on its Multiple Listing Service® in February, a decrease of 39 per cent compared to sales in January and a 38 per cent increase compared to the sales in February of last year. Active listings for the Fraser Valley finished at 5,741, increasing 12 per cent month-over-month and a decrease of 10 per cent when compared to February 2019. There were 2,557 new listings in February, a 15 per cent increase compared to January 2020 and a 15 per cent increase compared to February 2019. “Supply is a challenge currently in some areas and for certain property types. In February, in Langley for example, for every 10 active townhomes, six sold. In Cloverdale, there were 26 active condo listings last month; and 20 sold. We are seeing more traffic at open houses, more multiple offers and a slight increase in year-over-year prices,” said Darin Germyn, President of the Fraser Valley Real Estate Board. “Another indicator and in February, the three main residential property types sold on average six days faster than last year.”
Here’s a summary of the numbers:
Greater Vancouver: Total Units Sold in February 2020 was 2,185 – up from 1,602 (36%) in January 2020, up from 1,512 (45%) in February 2019, down from 2,241 (2%) in February 2018; Active Listings are at 9,894 compared to 12,207 (down 19%) at this time last year; New Listings in February 2020 were up 3% compared to February 2019 and down 6% compared to February 2018. Month’s Supply of Total Residential Listings is at 5 Month’s Supply (Balanced with signs of Seller’s Market conditions in some areas and product types) and a Sales to Listings Ratio of 53% compared to 38% in February 2019 and 51% in February 2018.
Vancouver Westside Residential: Total Units Sold in February 2020 was 367 – up from 275 (33%) in January 2020, up from 254 (44%) in February 2019, down from 429 (14%) in February 2018; Active Listings are at 1,774 compared to 2,333 (down 24%) at this time last year; New Listings in February 2020 were down 20% compared to February 2019 and down 21% compared to February 2018. Month’s Supply of Total Residential Listings is at 5 Month’s Supply (Balanced with signs of Seller’s Market conditions in some areas and product types) and a Sales to Listings Ratio of 52% compared to 29% in February 2019 and 48% in February 2018.
Vancouver East Side Residential: Total Units Sold in February 2020 was 243 – up from 161 (51%) in January 2020, up from 166 (46%) in February 2019, down from 244 (1%) in February 2018; Active Listings are at 837 compared to 1,119 (down 25%) at this time last year; New Listings in February 2020 were up 14% compared to February 2019 and down 7% compared to February 2018. Month’s Supply of Total Residential Listings is at 3 Month’s Supply (Balanced with signs of Seller’s Market conditions in some areas and product types) and a Sales to Listings Ratio of 55% compared to 43% in February 2019 and 51% in February 2018.
North Vancouver Residential: Total Units Sold in February 2020 was 206 – up from 100 (106%) in January 2020, up from 124 (66%) in February 2019, down up 166 (24%) in February 2018; Active Listings are at 612 compared to 814 (down 25%) at this time last year; New Listings in February 2020 were up 11% compared to February 2019 and down 25% compared to February 2018. Month’s Supply of Total Residential Listings is at 3 Month’s Supply (Balanced with signs of Seller’s Market conditions in some areas and product types) and a Sales to Listings Ratio of 56% compared to 37% in February 2019 and 52% in February 2018.
West Vancouver: Total Units Sold in February 2020 was 57 – up from 29 (97%) in January 2020, up from 39 (46%) in February 2019, up from 42 (36%) in February 2018; Active Listings are at 536 compared to 635 (down 16%) at this time last year; New Listings in February 2020 were down 15% compared to February 2019 and down 30% compared to February 2018. Month’s Supply of Total Residential Listings is at 9 Month’s Supply (Buyer’s Market) and a Sales to Listings Ratio of 40% compared to 23% in February 2019 and 20% in February 2018.
Richmond Residential: Total Units Sold in February 2020 was 253 – up from 227 (11%) in January 2020, up from 155 (63%) in February 2019, down from 262 (3%) in February 2018; Active Listings are at 1,470 compared to 1,842 (down 20%) at this time last year; New Listings in February 2020 were up 7% compared to February 2019 and down 21% compared to February 2018. Month’s Supply of Total Residential Listings is at 6 Month’s Supply (Balanced with signs of Seller’s Market conditions in some areas and product types) and a Sales to Listings Ratio of 50% compared to 33% in February 2019 and 41% in February 2018.
Burnaby East: Total Units Sold in February 2020 was 32 – up from 18 (78%) in January 2020, up from 17 (88%) in February 2019, down from 34 (6%) in February 2018; Active Listings are at 91 compared to 121 (down 25%) at this time last year; New Listings in February 2020 were up 6% compared to February 2019 and down 43% compared to February 2018. Month’s Supply of Total Residential Listings is at 3 Month’s Supply (Seller’s Market conditions) and a Sales to Listings Ratio of 84% compared to 47% in February 2019 and 51% in February 2018.
Burnaby North: Total Units Sold in February 2020 was 100 – up from 96 (4%) in January 2020, up from 84 (19%) in February 2019, up from 89 (12%) in February 2018; Active Listings are at 368 compared to 482 (down 24%) at this time last year; New Listings in February 2020 were up 21% compared to February 2019 and up 11% compared to February 2018. Month’s Supply of Total Residential Listings is at 4 Month’s Supply (Balanced with signs of Seller’s Market conditions in some areas and product types) and a Sales to Listings Ratio of 52% compared to 53% in February 2019 and 51% in February 2018.
Burnaby South: Total Units Sold in February 2020 was 105 – up from 90 (17%) in January 2020, up from 83 (27%) in February 2019, down from 135 (22%) in February 2018; Active Listings are at 466 compared to 678 (down 31%) at this time last year; New Listings in February 2020 were down 8% compared to February 2019 and up 6% compared to February 2018. Month’s Supply of Total Residential Listings is at 4 Month’s Supply (Balanced with signs of Seller’s Market conditions in some areas and product types) and a Sales to Listings Ratio of 55% compared to 40% in February 2019 and 75% in February 2018.
New Westminster: Total Units Sold in February 2020 was 90 – up from 50 (80%) in January 2020, up from 63 (43%) in February 2019, down from 103 (13%) in February 2018; Active Listings are at 311 compared to 430 (down 28%) at this time last year; New Listings in February 2020 were down 7% compared to February 2019 and down 1% compared to February 2018. Month’s Supply of Total Residential Listings is at 3 Month’s Supply (Balanced with mostly signs of Seller’s Market conditions in some areas and product types) and a Sales to Listings Ratio of 59% compared to 38% in February 2019 and 67% in February 2018.
Coquitlam: Total Units Sold in February 2020 was 196 – up from 144 (36%) in January 2020, up from 134 (46%) in February 2019, up from 178 (10%) in February 2018; Active Listings are at 612 compared to 832 (down 26%) at this time last year; New Listings in February 2020 were up 13% compared to February 2019 and up 9% compared to February 2018. Month’s Supply of Total Residential Listings is at 3 Month’s Supply (Balanced with mostly signs of Seller’s Market conditions in some areas and product types) and a Sales to Listings Ratio of 60% compared to 46% in February 2019 and 60% in February 2018.
Port Moody: Total Units Sold in February 2020 was 36 – down from 37 (3%) in January 2020, up from 30 (20%) in February 2019, down from 42 (14%) in February 2018; Active Listings are at 171 compared to 181 (down 6%) at this time last year; New Listings in February 2020 were up 30% compared to February 2019 and up 22% compared to February 2018. Month’s Supply of Total Residential Listings is at 5 Month’s Supply (Balanced with signs of Seller’s Market conditions in some areas and product types) and a Sales to Listings Ratio of 33% compared to 38% in February 2019 and 47% in February 2018.
Port Coquitlam: Total Units Sold in February 2020 was 83 – up from 60 (38%) in January 2020, up from 60 (38%) in February 2019, down from 84 (1%) in February 2018; Active Listings are at 195 compared to 302 (down 35%) at this time last year; New Listings in February 2020 were up 10% compared to February 2019 and down 2% compared to February 2018. Month’s Supply of Total Residential Listings is at 2 Month’s Supply (Seller’s Market conditions) and a Sales to Listings Ratio of 65% compared to 43% in February 2019 and 65% in February 2018.
Ladner: Total Units Sold in February 2020 was 36 – up from 35 (3%) in January 2020, up from 20 (80%) in February 2019, up from 19 (89%) in February 2018; Active Listings are at 156 compared to 149 (up 5%) at this time last year; New Listings in February 2020 were up 34% compared to February 2019 and down 49% compared to February 2018. Month’s Supply of Total Residential Listings is at 4 Month’s Supply (Balanced with signs of Seller’s Market conditions in some areas and product types) and a Sales to Listings Ratio of 54% compared to 40% in February 2019 and 42% in February 2018.
Tsawwassen: Total Units Sold in February 2020 was 32 – up from 21 (52%) in January 2020, up from 21 (52%) in February 2019, up from 29 (10%) in February 2018; Active Listings are at 207 compared to 195 (up 6%) at this time last year; New Listings in February 2020 were down 2% compared to February 2019 and down 19% compared to February 2018. Month’s Supply of Total Residential Listings is at 6 Month’s Supply (Balanced Market conditions) and a Sales to Listings Ratio of 59% compared to 38% in February 2019 and 43% in February 2018.
Pitt Meadows: Total Units Sold in February 2020 was 27 – up from 19 (42%) in January 2020, up from 15 (80%) in February 2019, down from 34 (21%) in February 2018; Active Listings are at 86 compared to 111 (down 22%) at this time last year; New Listings in February 2020 were up 24% compared to February 2019 and up 16% compared to February 2018. Month’s Supply of Total Residential Listings is at 3 Month’s Supply (Mostly a Seller’s Market with some Balanced Market Conditions) and a Sales to Listings Ratio of 52% compared to 36% in February 2019 and 77% in February 2018.
Maple Ridge: Total Units Sold in February 2020 was 177 – up from 120 (48%) in January 2020, up from 100 (77%) in February 2019, up from 158 (12%) in February 2018; Active Listings are at 609 compared to 626 (down 2%) at this time last year; New Listings in February 2020 were up 43% compared to February 2019 and up 28% compared to February 2018. Month’s Supply of Total Residential Listings is at 3 Month’s Supply (Mostly a Seller’s Market with some Balanced Market Conditions) and a Sales to Listings Ratio of 59% compared to 48% in February 2019 and 68% in February 2018.
Kevin Skipworth
Managing Broker/Partner