
Highlights of our August 2022 report
Total new listings in August the lowest in more than 28 years
Ladner townhouses and condos fall to 1-month supply
At least six major condo projects have stopped or stalled this year
Existing condos, townhouses can’t be replaced at their current value
Surrey strata housing starts fall 69% this year compared to 2021
Port Coquitlam is down to 2 months supply overall and 1 month supply for townhouses
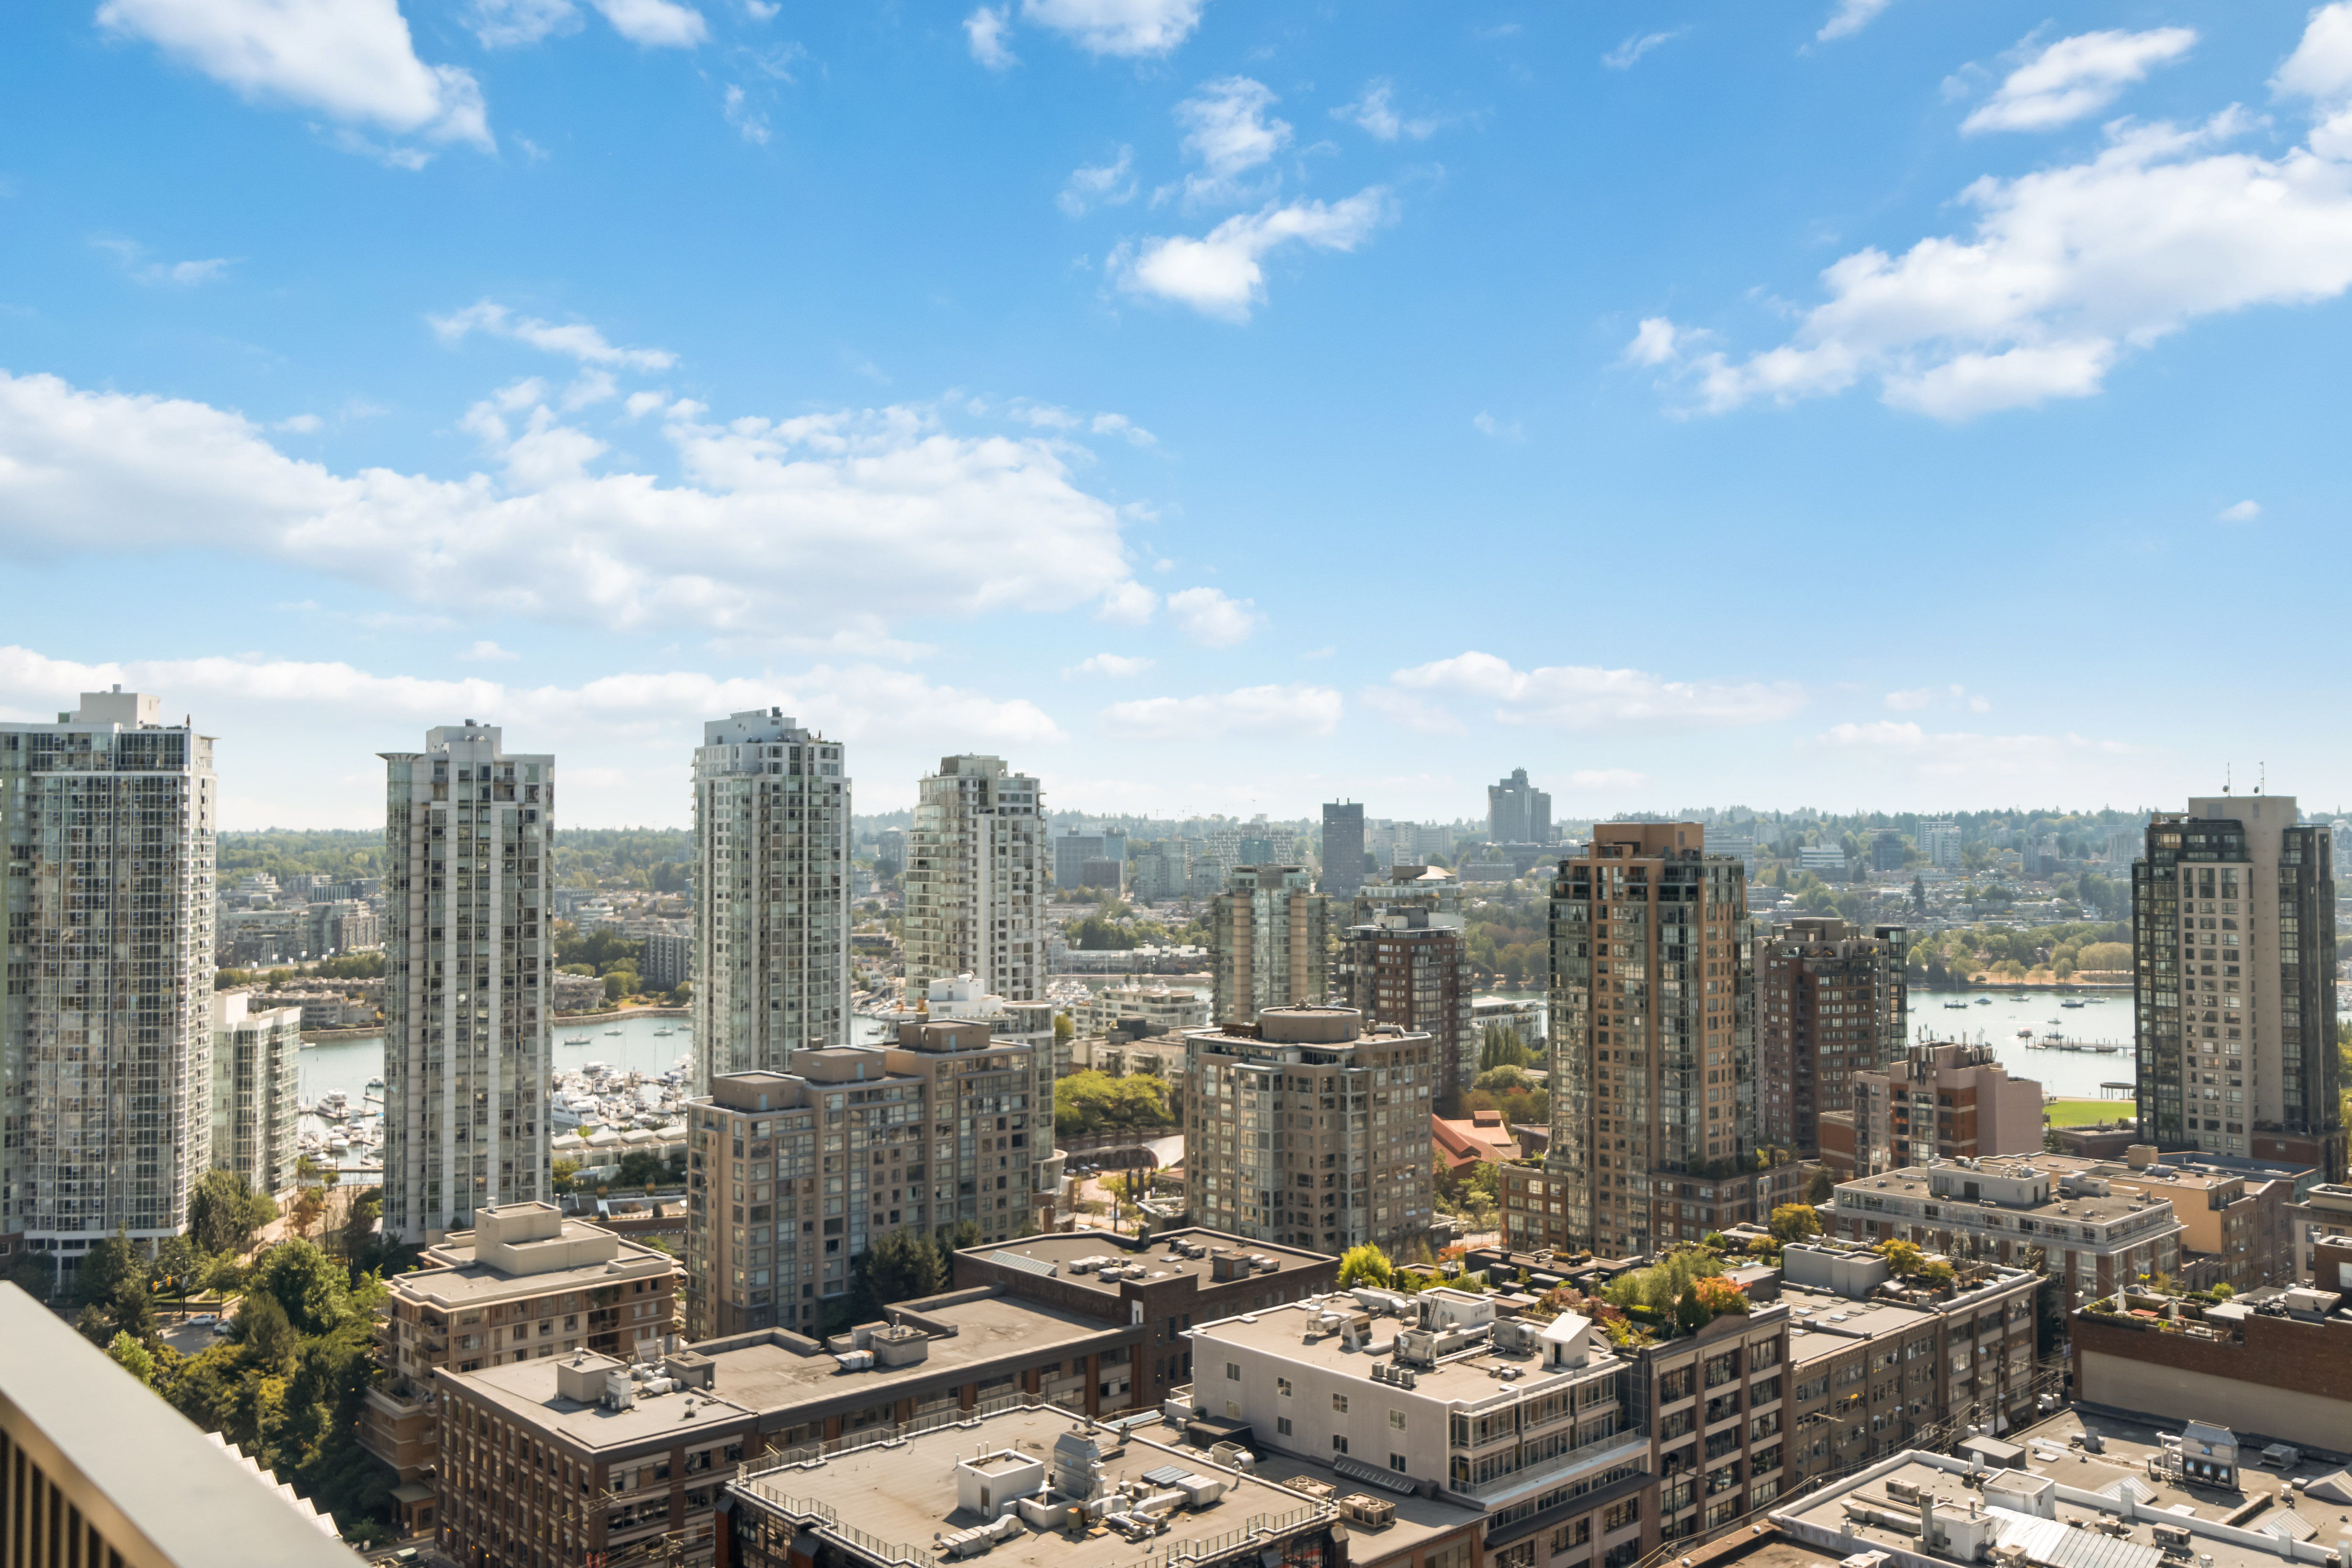
The major takeaway from the Metro Vancouver housing market is that both the number of new listings and the numbers of new homes being built are flirting with record lows. New listings of homes for sale fell to 3,383 in August, the lowest level in more than 28 years, while starts of new strata units plunged 43% year-over-year as of August 1, to just 6,596 new units – and this includes all Greater Vancouver plus Surrey and Langley.
Understanding the pull back in resale listings is not difficult. This August offered the distraction of splendid weather and the lifting of COVID travel and other restrictions for the first summer in two years. Plus, a slowdown in home sales, rising interest rates and flatlining prices convinced many potential sellers to hesitate in listing their property. We fully expect that the return to school and work this fall will see the traditional rise in home listings and sales.
Reasons for the dramatic drop in non-rental homes being built are more complicated and it is harder to estimate when starts will begin to increase. Without a dramatic adjustment, we could be looking at a shortage of new homes in Metro Vancouver to continue for months, perhaps years, despite all the calls to increase the housing supply. At the end of 2021, 17 new strata projects in Metro Vancouver were being advertised as “coming soon” and had plans to begin marketing in early spring. Of these, six have been delayed and the other 11 could not provide an opening date for a launch, or the developers said marketing of pre-sales would not proceed until this fall.
Of the 8 new strata projects that did decided to rest pre-sales in August - with, of course, no construction underway - average sales totaled about 20% of the units offered - the same as in June and July and down from the 30% to 40% sales success in the summer of 2021. The simple reason is that the developers, facing historically high land prices, higher government fees and charges, and soaring construction costs, cannot deliver a new condo or townhouse that is priced anywhere close to that of the resale market.
One of the last big condo tower blowout sales in downtown Vancouver – which sold out in 2020 – had an average price per square foot of more than $2,000. New projects going up the Cambie/Oakridge area are asking $3,000 per square foot, as are new towers planned for Coal Harbour. The average new condo or townhouse price is more than $1,600 per square foot, while resale prices on Vancouver’s West Side average $1,200 per square foot and are $837 per square foot or less in East Vancouver and most suburban markets.
Dexter Realty alone has an existing downtown Vancouver condo on Howe Street listed at $1,200 per square foot; a Kitsilano 724-square-foot wood-frame condo on West 3rd Avenue listed at $699,000 ($965 per square foot); and an exceptional 836-square-foot 2-bedroom concrete condo in New Westminster priced at $529,000, the equivalent of $632 per square.
Based on current developer costs, none of these existing condos could be reproduced today at the current listing price. For example, in the city of Vancouver, city development fees and charges alone average $186,000 on a new condo, and this does not include the federal GST which nails another 5% to the cost to the consumer, or the 30% increase in building material costs over the past year.
How crazy are residential development land prices getting? This August, a 1.3-acre land assembly of three detached house lots in Langley near a proposed new SkyTrain extension sold for $18 million – the equivalent of nearly $14 million an acre. The assembly has potential for 159 new townhouses, but each would have more than $118,000 baked in just for land costs. Similar scenarios are seen across the Metro region.
Now, there is concern that rental projects will also be put on hold because the cost of development outstrips the level of market rent that can be achieved. One rental developer explained that her input costs totaled $200 per buildable square foot meaning “the pro-forma for a rental doesn’t work at all.”
Of course the elephant in the room continues to be supply. Even with the discussion turning to the need to produce more, immigration levels are only beginning to ramp up and the need for homes is only going to intensify. This month we’ll see what the allowable rental increase for 2023 will be, and for a rental market that is seeing extreme pressure due to a lack of rental supply, that’s only going to lead to higher rents and competition in that part of the market.
The best advice for first-time buyers or investors is to purchase right now while there is a clear buyer’s advantage and to purchase a resale condo in transit-rich areas like East Vancouver, New Westminster and Surrey, where we are seeing a ballooning shortage of both new rental and strata properties.
Meanwhile for family buyers, it is time to refocus on the detached market, which has seen the sharpest sales slowdown this year of any property type.
August sales of detached houses in Greater Vancouver fell 45.3% from August 2021 and benchmark house prices have been dropping an average of 2.2 % month-over-month since February. In August, only 12.2% of detached active house listings sold (8 months supply), compared to 25% for strata units (4 months supply).
In the Fraser Valley, the benchmark price for a single-family detached house decreased 5.1% (about $71,000) compared to a month earlier.
Detached houses are in a buyer’s market right now and serious buyers should take full advantage. Markets to watch for detached house values are the West Side of Vancouver, where the median house price fell by $400,000 from July to August, even as sales increased; and North Vancouver and Richmond, where median prices for detached houses were down $185,000 and $100,000, respectively, in August from July.
Detached house values are largely based on the value of land, which is becoming a scarce and expensive commodity across Metro Vancouver. So, think long term as always in real estate.
Regional highlights for August 2022
Greater Vancouver: There were a total of 1,891 home sales in August, down just 1% from July 2022 but 23% lower than in August 2021 and even 14% lower than in August 2019. Active Listings were at 10,099 at month end compared to 9,494 at that time last year and 10,734 (down 6%) at the end of July. New Listings in August are down 17% compared to July 2022 and 13% lower than in August 2021. The total supply of residential listings is down to 5 month’s supply (balanced market conditions) and the sales to listings ratio of 56% compared to 47% in July 2022 and 77% in August 2021. The benchmark composite home price was $1,180,500. This was down 2.2% compared to July 2022 but a 7.4 per cent increase over August 2021.
The market is very much acting like a buyer’s market in many areas and product types. Subject to sale is coming into play more and more, and buyers can have time with subjects. Multiple offers will happen but not to the same extent we saw earlier this year. And certainly not with the same fever that has been occurring in the last two years. And while the condo market in the last few months has been stronger, in August in many areas sales of detached and townhouses outpaced the number of sales in July. Perhaps settling into the interest rate climate we are in and buyers taking advantage of price declines that have happened in that market segment.
Fraser Valley: In August, the Fraser Valley Real Estate Board processed 1,017 sales, an increase of 2.4 per cent compared to July 2022 but a 51.3% decrease compared to August 2021. New listings reached 2,045, down 14.3% from July and 2.9% below August 2021. While all benchmark prices were up from a year earlier, detached house prices were down 5.1% from July 2022, to $1,513,500; townhouse prices were down 3.9% month-over-month and condo apartment prices fell 2.1% from July 2022.
Vancouver Westside: Detached houses on Vancouver’s Westside have long been the poster child of B.C.’s high housing prices and soaring sales. That changed somewhat as of August. With 57 sales in the month, detached house transactions were slightly higher than a month earlier but nearly 50% below August 2021, when 107 houses sold. But the median price of a Westside detached house in August, at $3,050,000 was down $300,000 from July 2022 and more than $280,000 less than in August of last year. Total sales of all property types in August reached 380 transactions, up 3% from July 2020 but down 15% from a year earlier. Townhouse prices, at a median of $1,300,000 were down more than $200,000 from both a month and a year earlier. Condos, which led sales with 282 transactions in August, saw the median price reach $829,000, down slightly from July 2022, but up from the median of $775,000 in August 2021. Total active listings were at 2,279 at month end compared to 2,389 at that time last year and 2,453 (down 7%) at the end of July 2020. New listings in August are down 12% compared to July 2022 and down 19% compared to August 2021. The current sales-to-listings ratio of 52% compares to 44% in July 2022 and 65% in August 2021. This remains in a balanced market, but the detached housing sector is into a buyer’s advantage.
Vancouver East Side: We believe the East Side represents one of the best housing markets in the Metro region and August proved the point. There were the same number of detached sales on the East as the West side of Vancouver, at 57, but the median house price on the East Side, at $1,768,000 was $1.28 million less than on the Westside – and East Side detached prices, unlike the Westside and most of Greater Vancouver, were higher than in July 2022 and in August 2021. A further surprise is that East Side townhouse prices, at a median of $1,384,500 in August, and sales, at 52, were the highest of any market in Metro Vancouver, including the Westside. Total housing sales were 196 in August, down just 1% from a month earlier. Active listings were at 1,103 at month end compared to 1,090 at that time last year and down 7% at the end of July 2022. New listings in August were down 24% compared to July 2022, and 22% lower compared to August 2021. The overall sales-to-listings ratio is 59% compared to 45% in July 202 and 69% in August 2021. While detached homes show buyer’s market sales, the other sectors remain a seller’s market and that is not likely to change anytime soon.
North Vancouver: There is new residential construction underway in North Vancouver this year, but it is dominated by rentals. As of August 1, for instance, 742 rental units had started, compared to just 202 strata units, including just 39 townhouses. Meanwhile, new listings of homes for sale in August were down 25% compared to a month earlier and total listings were only 524 at month end, down 8% from July. With 126 total sales in August, down 27% from a month earlier, prices for all types of property were also lower, despite a healthy sales-to-listing ratio of 56%. The median detached house price in August was $1,835,000, down from $2,020,000 in July; while townhouse prices were slightly lower at a median of $1,300,000; and condo apartment prices were down about $25,000 from July, at $700,219.
West Vancouver: Due to policy changes late last year which caused a rush of permit applications to beat a January 31 deadline, West Vancouver is facing a huge backlog of applications so don’t expect many new homes to start this year. The entire housing market is down, with 53 sales in August, 13% lower than in July and down 21% from a year earlier. The overall benchmark composite home price, at $2,774,00 has barely budged in six months and was down 1.3% from this July. Active listings were at 565 at month end compared to 536 at that time last year and 580 (down 3%) at the end of July. The August sales-to-listings ratio of 35% compares to 32% in July 2022 and 52% in August 2021. This buyer’s market remains relatively slow but stable.
Richmond: Richmond August housing sales, at 226, were higher than in July, increasing just 1% month over month, but down 33% from August 2021. Benchmark detached house prices have been slipping lower each month for six months and dipped a further 1% from July to $2,111,300. A shortage of strata units is looming, however, which may put a floor under strata prices. Richmond has seen several condo projects put on hold and the result is that just 282 new condo units have started this year, compared to 916 at the same time in 2021. Townhouse starts fell about 12% from last year to 96 units. Total new listings in August were down 13% compared to July 2022 and down 30% compared to August 2021, and even 27% lower than in August 2019. The supply of total residential listings is steady at 6 month’s supply and the sales- to-listings ratio of 60% compares to 52% in July 2022 and 82% in August 2021. This is technically a buyer’s market but appears to be leaning this summer to a buyer’s advantage, especially in the detached-house sector.
Burnaby East: Burnaby East posted the lowest sales of any Burnaby area, with just 20 transactions in August, the lowest level for that month in at least three years and down 9% from July 2020. The benchmark composite home price has now dropped nearly 8% over the past six months to settle at $1,109,000 in August. Active Listings were at 75 at month end compared to 83 at that time last year and 68 at the end of July. New listings in August are down 18% compared to July 2022 and 47% lower compared to August 2021. This remains a seller’s market, with a sales-to-listings ratio of 74%.
Burnaby North: By this time next year, giant Grosvenor will have construction underway for 3,500 homes, including about 900 strata units in the Brentwood Block in the Brentwood Town Centre. Meanwhile the benchmark price for a Burnaby North condo apartment in August was down 2.4% from a month earlier to $717,300, but still 11.5% higher than a year ago. Total housing sales in August were 120, down 3% from July 2022, and 34% lower when compared to August 2021. Active listings were 448 at month end, 6% less than at the end of July. New listings were down 22% compared to July 2022, and the lowest level for August since 2019. The sales-to-listings ratio of 63% is down from 76% a year ago but this market retains a seller’s advantage.
Burnaby South: Benchmark prices for detached houses and townhouses have been tracking down steadily, with detached houses shedding 9.2% in value since June to $2,105,200 in August, while townhouses have dropped 9.5% in the past three months to $964,300. Still, with active listings down 12% from July, total sales down 2% in the same period and the sales-to-listing ratio running at 73% in August, Burnaby South remains a hot seller’s market. The condo market is especially strong with benchmark prices down just 1.2% from the February peak at $776,300, the highest condo price in Burnaby.
New Westminster: If it were not for 452 subsidized rentals, few new housing starts would have registered in New Westminster this year. As it was, starts of strata units fell to just 185 homes through the first seven months of 2022, compared to 1,255 strata starts – including 65 townhouses – at the same time in 2021. This may be bad news for future buyers because active listings in August were down to just 280 homes and new listings were down 20% from a month earlier to the lowest level since at least August 2019. With 77 sales in August, the sales-to-listing ratio was 65%, compared to 88% a year earlier. Benchmark prices for all property types have been declining, however, led by a 11.1% reduction in detached house prices from six months earlier to $1,450,100 in August. Townhouse and condo apartment prices have been slipping down for three months to settle at $922,800 and $651,000, respectively.
Coquitlam: More strata housing starts are being seen this year – a total of 1,342 units as of August 1 – in the Tri-Cities than any other market in the Lower Mainland and the bulk of the activity is in Coquitlam. This bodes well for a municipality where August sales – at 157 – were up 11% from July and where the sales-to-listing ratio is at 59%. This is down from 93% a year ago, but still one of the strongest in Metro Vancouver. Both active and new listings were down slightly from a month earlier, with a total of 616 homes available at the end of August. The benchmark composite price was down 2.6% from July and off nearly 6% from six months earlier, at $1,104,000 in August. Detached houses sold at a benchmark of $1,794,700n in August, while townhomes fetched $1,058,000 and condo prices were down 1.7% from July at a benchmark of $669,200.
Port Moody: Total homes sold in August were 33 – down from 45 (- 27%) in July 2022 and down from 57 (-42%) in August 2021. Active listings were at 202 at month end compared to 155 at that time last year and 203 (down just 0.5%) at the end of July. New Listings in August are down 7% compared to July 2022. Month’s supply of total residential listings is up to 6 month’s supply (balanced market conditions) and sales to listings ratio of 43% compared to 54% in July 2022 and 73% in August 2021. The benchmark composite home price in August was $1,175,200, reflective of the higher detached-house values in the Belcarra neighbourhood.
Port Coquitlam: Total housing sales in August were 78, up 10% from July 2022 but, down 20% compared to August 2021. But total active listings dropped 16% from a month earlier to 178, resulting in a sales-to-listing ratio of 76%, one of the highest in Greater Vancouver. There is just a 2-month supply of homes on the market. Benchmark prices, however, remain relatively low at a composite price of $917,200 in August, with detached houses selling for $1,328,100 a price down 13% from six months earlier and nearly 5% lower than in July 2022.
Pitt Meadows: Just 17 homes sold during August, down 13% from July and 56% lower than in pre-pandemic August 2019. The surge in sales and prices seen through the pandemic has clearly eased. The August benchmark detached house price was down 17.6% from six months earlier, at $1,253,800 and townhouse prices were down 5.6% in the same period to $905,500. Active listings nearly doubled from July to 96 at the end of August and new listings were 16% higher than a year earlier. With a sales-to-listing ratio at 39% - compared to 85% during the height of the pandemic in August 2020 – this market is tracking towards a buyer’s advantage.
Maple Ridge: With 113 total sales in August, up 5% from a month earlier, Maple Ridge posted a respectable 48% sales-to-listing ratio, indicating a balanced market but with sellers having a slight advantage. There were 602 active listings at the end of August, down from 655 at the end of July. The detached house benchmark price was down nearly 13% from six months earlier, at $1,279,200. Townhouses sold in August at benchmark of $750,700, down 5.3% from a month earlier and 14.6% below the price six months ago.
Ladner: Anyone who has driven past the exit to Ladner this year has seen the profusion of strata units, primarily townhouses, that sprang up over the past two years. And they continue to sell well, posting a 128% sales-to-listing ratio as 9 townhouses sold at a benchmark price of $884,800 in August, a price down, however, from $965,444 a month earlier. There is only a 1-month supply of townhouses on the Ladner market. Total sales in August of all properties were 27, up 108% from July. Total active listings were 99 at the end of August, down 12% from July and disappearing at sales ratio of 88%, compared to 32% a month earlier. Ladner remains a seller’s market, but there is just a total of 4-month’s supply of homes available.
Tsawwassen: Just 9 detached houses sold in Tsawwassen in August, the lowest level of any month since January of 2020. Yet, the average detached house price in August was $1,704,988, up 4% from a month earlier and well above the average of $1,540,600 in August of last year. Total August sales of all property reached only 25 transactions, down 11% from July and 66% below August of 2021. So far, prices are sticky, but this may change if sales continue to decline. The sales-to-listing ratio fell to 40% in August, down from 112% a year earlier and the lowest ratio in at least three years.
Surrey: The bloom came off the rosy Surrey housing market in August as detached house sales fell to 152 transactions, down 60.8% from a year earlier. Townhouse sales were down nearly 45% year over year and condo apartment sales, at 169, were 41.7% lower than in August 2021. Still, total sales were slightly higher than in July 2022 and benchmark prices held their own. The average detached house price in August was $1,636,086, down just 1.6% from July, with townhouse selling for $837,902, down 4.4% from a month earlier. The 169 condo sales in August traded at an average of $539,597, virtually unchanged from July 2021 but up nearly 12% from August of 2021. Surrey, however, has seen a fast decline in strata starts this year, with a total of 698 condo and townhouse started so far, compared to 2,321 in the first seven months of 2021.