
"It's not whether you get knocked down, it's whether you get up.” – Vince Lombardi
We will get back up! Considering the extent of lock down, the momentum of what March started certainly carried over into April. While sales were down and new listings were down, there was still participation in the market as Realtors found ways to present properties virtually and look at ways to ensure socially distanced showings could happen if necessary. Buyers were there and continue to be, with multiple offers occurring, even as of last week.
There were 1,119 homes sold of all types in Greater Vancouver in April this year compared with 2,562 homes sold last month, 1,850 sales in April last year and 2,631 homes sold in April 2018. Sales and listings were well below the ten-year average but actually higher than in November and December 2008 and January 2009, all three months below 1,000 homes sold. The last two weeks of April showed home sales average 48 per day compared with 138 per day during the first two weeks of March – a reduction of 75 per cent. New listings were down 51 per cent with there being an average of 122 per day compared to 253 per day at the beginning of March.
2020 Average Daily Sales by Week in Covid times:
First two weeks of March – 253 new listings, 138 sales
March 23 to 27 – 172 New Listings, 131 Sales
March 30 to April 3 – 104 new listings, 62 sales
April 6 to April 9 – 137 new listings, 58 sales
April 14 to 17 – 131 new listings, 63 sales
April 20 to 24 – 117 new listings, 48 sales
April 27 to May 1 – 126 new listings, 48 sales
With the reduction in the number of homes sold and the number of homes being listed, absorption of new listings was actually stronger this April then compared with April 2019, 47 per cent compared to 31 per cent. The 47 per cent this year was even better than April 2018 at 44 per cent. Buyers were more engaged with the limited number of new listings than we’ve seen in April for the last 2 years – with more incidents of multiple offers occurring. Had more homes come on to the market we would have likely seen more home sales as a result.
Some highlights from April:
Detached home sales in Vancouver West were slightly higher than January of this year, with a 58 per cent absorption rate and a slight increase in the average price for April compared to March
Detached home sales in most areas had high absorption rates compared to attached homes, perhaps a sign of a push towards separate space and less home owners willing to part with that and put their homes up for sale
The last two weeks of April showed the most significant lag in home sales and new listings, but similar to the end of March, home sales reported are from weeks previous and anecdotal reports indicated more activity amongst home buyers and sellers
While Month’s of Supply increased in April due to lower sales totals, pushing areas into Buyer’s Market Conditions on paper– this will be temporary and even with those conditions we are seeing sales that favor sellers.
The number of homes for sale in Greater Vancouver saw a slight decrease in April. At the end of April there were 10,115 homes for sale, compared to 10,315 at the end of March and 15,060 at the end of April 2019 – a 33 per cent reduction in the number of homes available year-over-year. As expected, the number of homes that came to market in April were half that of March with 2,399 homes listed for sale, compared with 4,521 in March. We will come out of this pandemic with an extremely under supplied housing market, for both resale homes and presale homes. And while there are already some anticipating a drop in home prices as a result, activity through the worst of the pandemic hasn’t indicated that so far. As local, national and global governments begin to open up economies, there will be more opportunities for increased activity in the housing market. Home owners will seek changes in where they live, having been through more time at home than ever before, and in conditions they have not experienced. Changes will be desired for some and required for others. And governments will be doing their part to push the economy forward – they have the tools to do so and will.
“Predictably, the number of home sales and listings declined in April given the physical distancing measures in place,” Colette Gerber, REBGV president-elect said, “People are, however, adapting. They’re working with the Realtors to get information, advice and to explore their options so that they’re best positioned in the market during and after this pandemic. We’re seeing more innovation in today’s market, with Realtors using different technology to showcase homes virtually, assess neighbourhood amenities with their clients and handle electronically.”
East of the Fraser River, the Fraser Valley Real Estate Board processed 688 sales of all property types on its Multiple Listing Service® in April, a decrease of 52 per cent compared to sales in March and a 50 per cent decrease compared to the sales in April of last year. According to the Fraser Valley Board, last month’s sales were on par with April sales in 1983 through to 1985; and new listings are in line with numbers last need in April 1981. There were 1,416 new listings in April, a 47 per cent decrease compared to March and a 58 per cent decrease compared to April of last year. April finished with 5,997 active listings, a decrease of 1 per cent compared to March’s inventory and a decrease of 24 per cent year-over-year. “Even though March’s initial numbers promised a banner spring, we expected the market to respond this way in April. Both sales and listings contracted in tandem as we all moved swiftly to embrace the measures necessary to respond to this global pandemic. Given that the volume of new listings coming on stream fell even faster than sales in April, the market remains stable,” Chris Shields, President of the Fraser Valley Real Estate Board.
More important than the housing market right now is focusing on getting through this pandemic and working to stay healthy and supporting those around us. The real estate market will continue and be much more active as social distancing measures and relaxations of those measures are allowed. Be safe and be careful.
Here’s a summary of the numbers:
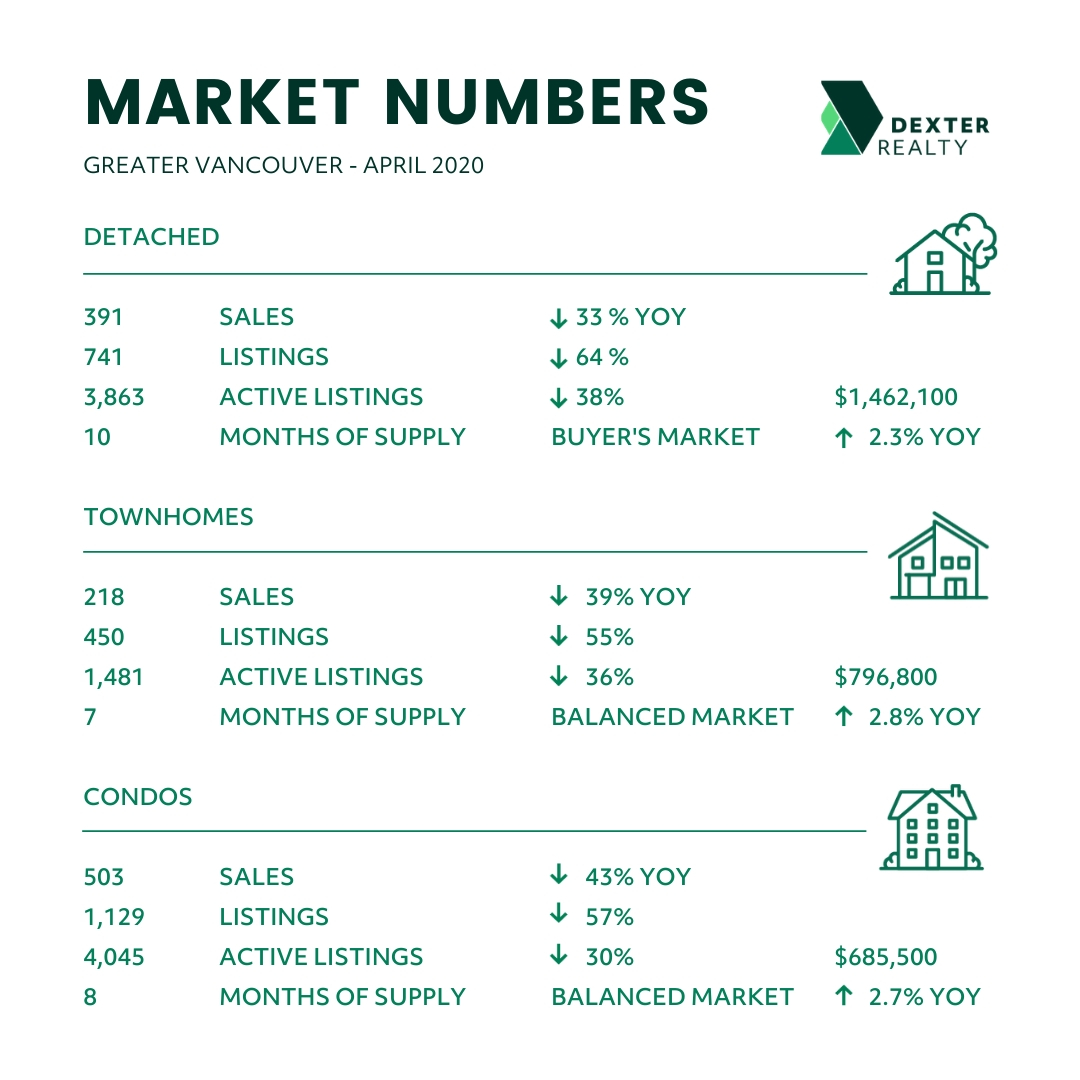
Greater Vancouver: Total Units Sold in April 2020 was 1,119 – down from 2,562 (56%) in March 2020, down from 1,850 (40%) in April 2019, down from 2,631 (57%) in April 2018; Active Listings are at 10,115 compared to 15,060 (down 33%) at this time last year; New Listings in April 2020 were down 59% compared to April 2019 and down 60% compared to April 2018. Month’s Supply of Total Residential Listings is at 9 Month’s Supply (Balanced with signs of Buyer’s Market conditions in some areas and product types) and a Sales to Listings Ratio of 47% compared to 31% in April 2019 and 44% in April 2018.
Vancouver Westside Residential: Total Units Sold in April 2020 was 195 – down from 467 (58%) in March 2020, down from 342 (43%) in April 2019, down from 467 (48%) in April 2018; Active Listings are at 1,760 compared to 2,808 (down 37%) at this time last year; New Listings in April 2020 were down 62% compared to April 2019 and down 62% compared to April 2018. Month’s Supply of Total Residential Listings is at 9 Month’s Supply (Balanced with signs of Buyer’s Market conditions in some areas and product types) and a Sales to Listings Ratio of 44% compared to 29% in April 2019 and 40% in April 2018.
Vancouver East Side Residential: Total Units Sold in April 2020 was 120 – down from 297 (60%) in March 2020, down from 174 (31%) in April 2019, down from 298 (60%) in April 2018; Active Listings are at 836 compared to 1,403 (down 40%) at this time last year; New Listings in April 2020 were down 58% compared to April 2019 and down 66% compared to April 2018. Month’s Supply of Total Residential Listings is at 7 Month’s Supply (Balanced with signs of Buyer’s Market conditions in some areas and product types) and a Sales to Listings Ratio of 49% compared to 36% in April 2019 and 42% in April 2018.
North Vancouver Residential: Total Units Sold in April 2020 was 96 – down from 204 (53%) in March 2020, down from 149 (36%) in April 2019, down from 221 (57%) in April 2018; Active Listings are at 633 compared to 1,049 (down 40%) at this time last year; New Listings in April 2020 were down 57% compared to April 2019 and down 54% compared to April 2018. Month’s Supply of Total Residential Listings is at 7 Month’s Supply (Balanced with signs of Buyer’s Market conditions in some areas and product types) and a Sales to Listings Ratio of 43% compared to 29% in April 2019 and 46% in April 2018.
West Vancouver: Total Units Sold in April 2020 was 29 – down from 56 (48%) in March 2020, down from 48 (40%) in April 2019, down from 56 (48%) in April 2018; Active Listings are at 527 compared to 723 (down 27%) at this time last year; New Listings in April 2020 were down 62% compared to April 2019 and down 64% compared to April 2018. Month’s Supply of Total Residential Listings is at 18 Month’s Supply (Buyer’s Market conditions) and a Sales to Listings Ratio of 31% compared to 19% in April 2019 and 21% in April 2018.
Richmond Residential: Total Units Sold in April 2020 was 137 – down from 337 (59%) in March 2020, down from 172 (20%) in April 2019, down from 312 (59%) in April 2018; Active Listings are at 1,386 compared to 2,220 (down 38%) at this time last year; New Listings in April 2020 were down 65% compared to April 2019 and down 65% compared to April 2018. Month’s Supply of Total Residential Listings is at 10 Month’s Supply (Buyer’s to Balanced Market conditions) and a Sales to Listings Ratio of 56% compared to 25% in April 2019 and 45% in April 2018.
Burnaby East: Total Units Sold in April 2020 was 12 – down from 27 (56%) in March 2020, down from 15 (20%) in April 2019, down from 35 (66%) in April 2018; Active Listings are at 101 compared to 153 (down 34%) at this time last year; New Listings in April 2020 were down 44% compared to April 2019 and down 52% compared to April 2018. Month’s Supply of Total Residential Listings is at 8 Month’s Supply (Balanced Market conditions) and a Sales to Listings Ratio of 38% compared to 26% in April 2019 and 53% in April 2018.
Burnaby North: Total Units Sold in April 2020 was 40 – down from 130 (69%) in March 2020, down from 81 (51%) in April 2019, down from 135 (70%) in April 2018; Active Listings are at 409 compared to 634 (down 35%) at this time last year; New Listings in April 2020 were down 51% compared to April 2019 and down 51% compared to April 2018. Month’s Supply of Total Residential Listings is at 10 Month’s Supply (Balanced Market conditions) and a Sales to Listings Ratio of 29% compared to 29% in April 2019 and 48% in April 2018.
Burnaby South: Total Units Sold in April 2020 was 55 – down from 143 (62%) in March 2020, down from 97 (43%) in April 2019, down from 108 (49%) in April 2018; Active Listings are at 463 compared to 819 (down 43%) at this time last year; New Listings in April 2020 were down 63% compared to April 2019 and down 63% compared to April 2018. Month’s Supply of Total Residential Listings is at 8 Month’s Supply (Balanced Market conditions) and a Sales to Listings Ratio of 52% compared to 34% in April 2019 and 38% in April 2018.
New Westminster: Total Units Sold in April 2020 was 61 – down from 118 (48%) in March 2020, down from 108 (44%) in April 2019, down from 133 (54%) in April 2018; Active Listings are at 333 compared to 533 (down 38%) at this time last year; New Listings in April 2020 were down 69% compared to April 2019 and down 63% compared to April 2018. Month’s Supply of Total Residential Listings is at 5 Month’s Supply (Balanced Market conditions) and a Sales to Listings Ratio of 69% compared to 38% in April 2019 and 56% in April 2018.
Coquitlam: Total Units Sold in April 2020 was 93 – down from 202 (54%) in March 2020, down from 153 (39%) in April 2019, down from 202 (54%) in April 2018; Active Listings are at 687 compared to 1,068 (down 36%) at this time last year; New Listings in April 2020 were down 59% compared to April 2019 and down 59% compared to April 2018. Month’s Supply of Total Residential Listings is at 7 Month’s Supply (Buyer’s Market conditions) and a Sales to Listings Ratio of 49% compared to 33% in April 2019 and 44% in April 2018.
Port Moody: Total Units Sold in April 2020 was 28 – down from 54 (48%) in March 2020, down from 60 (53%) in April 2019, down from 54 (48%) in April 2018; Active Listings are at 204 compared to 252 (down 19%) at this time last year; New Listings in April 2020 were down 61% compared to April 2019 and down 50% compared to April 2018. Month’s Supply of Total Residential Listings is at 7 Month’s Supply (Balanced Market conditions) and a Sales to Listings Ratio of 50% compared to 41% in April 2019 and 48% in April 2018.
Port Coquitlam: Total Units Sold in April 2020 was 42 – down from 96 (54%) in March 2020, down from 67 (37%) in April 2019, down from 103 (39%) in April 2018; Active Listings are at 197 compared to 395 (down 50%) at this time last year; New Listings in April 2020 were down 60% compared to April 2019 and down 58% compared to April 2018. Month’s Supply of Total Residential Listings is at 5 Month’s Supply (Balanced Market conditions) and a Sales to Listings Ratio of 54% compared to 34% in April 2019 and 56% in April 2018.
Ladner: Total Units Sold in April 2020 was 17 – down from 32 (47%) in March 2020, down from 29 (41%) in April 2019, down from 32 (47%) in April 2018; Active Listings are at 173 compared to 190 (down 9%) at this time last year; New Listings in April 2020 were down 45% compared to April 2019 and down 37% compared to April 2018. Month’s Supply of Total Residential Listings is at 10 Month’s Supply (Buyer’s Market conditions) and a Sales to Listings Ratio of 47% compared to 45% in April 2019 and 56% in April 2018.
Tsawwassen: Total Units Sold in April 2020 was 24 – down from 39 (38%) in March 2020, up from 18 (33%) in April 2019, down from 38 (37%) in April 2018; Active Listings are at 209 compared to 296 (down 29%) at this time last year; New Listings in April 2020 were down 61% compared to April 2019 and down 63% compared to April 2018. Month’s Supply of Total Residential Listings is at 9 Month’s Supply (Buyer’s to Balanced Market conditions) and a Sales to Listings Ratio of 56% compared to 17% in April 2019 and 32% in April 2018.
Pitt Meadows: Total Units Sold in April 2020 was 19 – down from 35 (46%) in April 2020, down from 28 (45%) in April 2019, down from 25 (24%) in March 2018; Active Listings are at 97 compared to 136 (down 28%) at this time last year; New Listings in April 2020 (31) were down 56% compared to April 2019 and down 47% compared to April 2018. Month’s Supply of Total Residential Listings is at 5 Month’s Supply (Mostly a Balanced Market with some Seller’s Market Conditions) and a Sales to Listings Ratio of 61% compared to 38% in April 2019 and 43% in April 2018.
Maple Ridge: Total Units Sold in March 2020 was 82 – down from 170 (52%) in March 2020, down from 124 (33%) in April 2019, down from 205 (60%) in April 2018; Active Listings are at 649 compared to 792 (down 18%) at this time last year; New Listings in April 2020 were down 55% compared to April 2019 and down 58% compared to April 2018. Month’s Supply of Total Residential Listings is at 8 Month’s Supply (Mostly Balanced Market Conditions) and a Sales to Listings Ratio of 54% compared to 36% in April 2019 and 57% in April 2018.
Kevin Skipworth
Managing Broker/Partner/Chief Economist