
Is this the real life? or is this just fantasy? Caught in a landslide, no escape from reality? The lyrics fit well right now. After seeing real estate sales in July be the highest in three years, the questions have been bouncing around as to whether this is a short-term result or a market intent on continuing to produce through the rest of 2020. With all that is happening in our world, it’s easy to contemplate the downside. We would be naïve to think that COVID-19 isn’t going to be a factor going forward – both in terms of the virus itself, or the economic conditions resulting from shutting down parts of society to deal with it. What we know is what is currently happening though– interest rates are the lowest they have ever been, pent up demand from over two years, not to mention the shut down in March and April, and a strong desire to find a different home have propelled the real estate market to where we are now. All these factors should not be underestimated in how the market will perform going forward.
There were 3,202 properties sold of all types in Greater Vancouver in July this year compared with 2,497
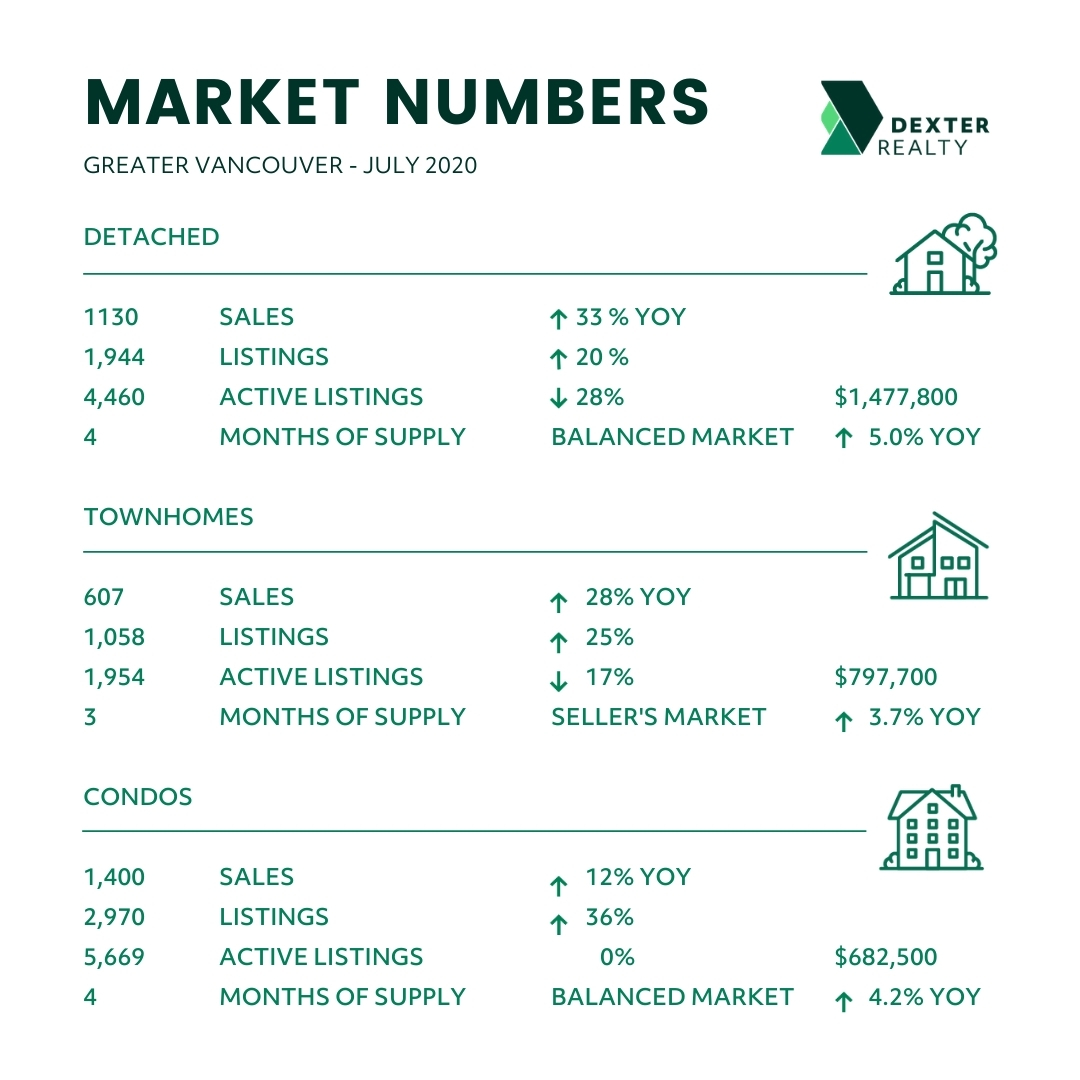
sold in June, 2,584 sales in July last year and 2,108 sold in July 2018. It was actually the seventh highest amount of sales for the month of July on record and the highest monthly sales amount since June 2017. Total home sales in July were 14 per cent above the ten-year average for the month and July saw the continued increase in the number of sales, week by week since the pandemic took hold. Looking at the different types of homes, detached home sales were up 33 per cent year over year, townhouses up 28 per cent year over year, apartments up 12 per cent year over year. Buyers have shown more interest in real estate with space over the last few months, but that doesn’t necessarily mean condos aren’t getting interest. We are still seeing multiple offers with them, with even the higher end of the condo market starting to see sales occurring where they had been absent in the previous months.
2020 Average Daily Sales in Greater Vancouver by Week:
First two weeks of March – 253 new listings, 138 sales
Last two week of March – 167 New Listings, 98 Sales
April – 120 new listings, 56 sales
May – 189 new listings, 75 sales
June 1 to 5 – 271 new listings, 88 sales
June 8 to 12 – 272 new listings, 107 sales
June 15 to 19 – 274 new listings, 120 sales
June 22 to 26 – 241 new listings, 129 sales
June 29 to July 3 – 311 new listings, 133 sales
July 6 to 10 – 302 new listings, 138 sales
July 13 to 17 – 294 new listings, 146 sales
July 20 to 24 – 258 new listings, 151 sales
July 27 to 31 – 245 new listings, 154 sales
Some highlights from July:
East Vancouver, North Vancouver, New Westminster, Coquitlam, Port Moody, Port Coquitlam, Pitt Meadows and Maple Ridge are all down to 3 month’s supply of active listings – Townhouses in Port Coquitlam are down to one-month supply
Richmond showed greater strength in the townhouse and condo market compared to the detached market with detached still in balanced to buyer’s market conditions while townhouses and condos have moved into seller’s market conditions
The number of detached homes available has declined by 28 percent compared to July last year, while townhouses and condos have declined 17 per cent and 15 per cent respectively
Vancouver’s Westside and Burnaby South had less sales in July this year compared to July last year – down 3 per cent and 25 per cent respectively which wasn’t consistent with all other areas
We saw a slight increase in the number of new listings in July, which was 22 per cent higher than the ten-year average for the month of July. As a result, at the end of July there were 12,796 homes for sale, compared to 12,146 at the end of June but still less than the 15,037 available at the end of July 2019 – a 15 per cent reduction in the number of homes available year-over-year. There is still a limited amount of homes available for sale which is resulting in multiple offers still occurring in all segments of the market – including two properties in Vancouver listed over $8 million that sold over the list price. Metro Vancouver isn’t the only place that is experiencing this. Throughout Canada and the United States, the number of homes for sale is down year-over-year. Even with the higher number of active listings last year those inventories were still low considering the lack of sales activity in the market here in Metro Vancouver. While we don’t know how long the pent-up demand will play out, the number of homes for sale is not likely to increase enough. Unlike recent reports of significant increase in condos for sale in Toronto, we still have a lack of supply here with Vancouver’s Westside condos at 5 month’s supply and Vancouver’s East side at 3 month’s supply.
What’s next? Will August continue the trend of a real estate market on the rise. For Greater Vancouver, the pent-up demand is not just from COVID but from almost three years of the market reacting to new taxes and restrictions on buyers. At some point activity would have increased and we saw that trend emerging just prior to COVID. Key points to consider are that interest rates are going to remain low in the years to come, real estate will be seen as a better long term investment vehicle and home owners are going to continue to look at the space they are living in and consider alternative locations or types of homes for the next phase of their life. That has been a theme over the last few months, and with the continued presence of COVID, we’ve likely seen just the start of homeowners making “COVID” moves. And when mobility increases within Canada and from outside, British Columbia and especially Metro Vancouver is going to be seen as a destination once again and likely more so than ever before. How we’ve fared thus far in COVID times has not gone unnoticed – especially from our neighbours to the south.
“We’re seeing the results today of pent up activity, from both home buyers and sellers, that had been accumulating in our market throughout the year,” Colette Gerber, REBGV Chair said, “Low interest rates and limited overall supply are also increasing competition across our market.”
East of Vancouver, the Fraser Valley Real Estate Board processed 2,100 sales of all property types on its Multiple Listing Service® in July, an increase of 22.2 per cent compared to sales in June and a 44 per cent decrease compared to the 1,458 sales in July of last year. Last month’s sales were 22.5 per cent above the ten-year average for July and second only to July 2015. There were 3,549 new listings in July, a 2.7 per cent increase compared to June and a 26.9 per cent increase compared to July of last year. July’s new listings were 18.3 per cent above the ten-year average for the month and second only to July 2008. July finished with 7,341 active listings, an increase of 3.9 per cent compared to June’s inventory and a decrease of 12 per cent year-over-year. “In the context of the current pandemic environment, our market is significantly ahead of what we anticipated. We’re seeing the market conditions representing a seller’s market for townhomes and single-family homes in the Fraser Valley. For example, in North Delta, Cloverdale, Langley, Abbotsford and Mission, for every 100 active detached listings, 40 or more sold in July.” Chris Shields, President of the Fraser Valley Real Estate Board said. “We attribute it to continued pent-up demand from what would have been a strong spring market for us; and clearly, near record-setting low interest rates. Buyers should take note that in some of our communities, the lack of supply and increase in demand is putting upward pressure on homes prices. The average price of a detached home in our region set a record high in July, last set two years ago during the same month.”
Here’s a summary of the numbers:
Greater Vancouver: Total Units Sold in July was 3,202 – up from 2,497 (28%) in June 2020, up from 2,584 (24%) in July 2019, up from 2,108 (52%) in July 2018; Active Listings are at 12,796 compared to 15,037 (down 15%) at this time last year; New Listings in July were up 3% compared to June 2020, up 30% compared to July 2019 and up 25% compared to July 2018. Month’s Supply of Total Residential Listings is down to 4 Month’s Supply (Balanced Market with strong signs of Seller’s Market conditions) and a Sales to Listings Ratio of 52% compared to 42% in June 2020, 55% in July 2019 and 43% in July 2018.
Vancouver Westside Residential: Total Units Sold in July was 472 – up from 409 (15%) in June 2020, down from 489 (3%) in July 2019, up from 403 (17%) in July 2018; Active Listings are at 2,489 compared to 2,572 (down 3%) at this time last year; New Listings in July were up 4% compared to June 2020, up 35% compared to July 2019 and up 36% compared to July 2018. Month’s Supply of Total Residential Listings is at 5 Month’s Supply (Balanced Market with strong signs of Seller’s Market conditions) and a Sales to Listings Ratio of 39% compared to 35% in June 2020, 40% in July 2019 and 45% in July 2018.
Vancouver East Side Residential: Total Units Sold in July was 344 – up from 280 (23%) in June 2020, up from 277 (24%) in July 2019, up from 227 (52%) in July 2018; Active Listings are at 1,164 compared to 1,341 (down 15%) at this time last year; New Listings in July were up 6% compared to June 2020, up 46% compared to July 2019 and up 27% compared to July 2018. Month’s Supply of Total Residential Listings is down to 3 Month’s Supply (Balanced Market with strong signs of Seller’s Market conditions) and a Sales to Listings Ratio of 50% compared to 43% in June 2020, 59% in July 2019 and 42% in July 2018.
North Vancouver Residential: Total Units Sold in July was 267 – up from 239 (12%) in June 2020, up from 205 (30%) in July 2019, up from 153 (75%) in July 2018; Active Listings are at 857 compared to 949 (down 10%) at this time last year; New Listings in July were down 6% compared to June 2020, up 35% compared to July 2019 and up 19% compared to July 2018. Month’s Supply of Total Residential Listings is at 3 Month’s Supply (Mostly Seller’s Market conditions) and a Sales to Listings Ratio of 54% compared to 45% in June 2020, 56% in July 2019 and 48% in July 2018.
West Vancouver: Total Units Sold in July was 68 – up from 62 (10%) in June 2020, up from 59 (15%) in July 2019, up from 57 (19%) in July 2018; Active Listings are at 638 compared to 726 (down 12%) at this time last year; New Listings in July were down 11% compared to June 2020, up 29% compared to July 2019 and up 13% compared to July 2018. Month’s Supply of Total Residential Listings is down to 9 Month’s Supply (Buyer’s Market conditions) and a Sales to Listings Ratio of 35% compared to 28% in June 2020, 39% in July 2019 and 33% in July 2018.
Richmond Residential: Total Units Sold in July was 363 – up from 272 (33%) in June 2020, up from 270 (34%) in July 2019, up from 284 (28%) in July 2018; Active Listings are at 1,603 compared to 2,309 (down 31%) at this time last year; New Listings in July were down 1% compared to June 2020, up 2% compared to July 2019 and down 3% compared to July 2018. Month’s Supply of Total Residential Listings is down to 4 Month’s Supply (Balanced Market with signs of Seller’s Market conditions) and a Sales to Listings Ratio of 58% compared to 43% in June 2020, 49% in July 2019 and 44% in July 2018.
Burnaby East: Total Units Sold in July was 32 – up from 31 (3%) in June 2020, up from 14 (129%) in July 2019, up from 21 (52%) in July 2018; Active Listings are at 139 compared to 166 (down 16%) at this time last year; New Listings in July were up 17% compared to June 2020, up 51% compared to July 2019 and up 24% compared to July 2018. Month’s Supply of Total Residential Listings is down to 4 Month’s Supply (Balanced Market with strong signs of Seller’s Market conditions) and a Sales to Listings Ratio of 47% compared to 36% in June 2020, 31% in July 2019 and 38% in July 2018.
Burnaby North: Total Units Sold in July was 141 – up from 107 (32%) in June 2020, up from 132 (7%) in July 2019, up from 88 (60%) in July 2018; Active Listings are at 566 compared to 630 (down 10%) at this time last year; New Listings in July were up 18% compared to June 2020, up 40% compared to July 2019 and up 56% compared to July 2018. Month’s Supply of Total Residential Listings is down to 4 Month’s Supply (Balanced Market with strong signs of Seller’s Market conditions) and a Sales to Listings Ratio of 43% compared to 39% in June 2020, 56% in July 2019 and 42% in July 2018.
Burnaby South: Total Units Sold in July was 114 – up from 93 (23%) in June 2020, up from 97 (14%) in July 2019, up from 76 (50%) in July 2018; Active Listings are at 641 compared to 807 (down 21%) at this time last year; New Listings in July were up 9% compared to June 2020, up 32% compared to July 2019 and up 20% compared to July 2018. Month’s Supply of Total Residential Listings is at 6 Month’s Supply (Balanced Market with some signs of Seller’s Market conditions) and a Sales to Listings Ratio of 36% compared to 32% in June 2020, 64% in July 2019 and 29% in July 2018.
New Westminster: Total Units Sold in July was 164 – up from 97 (69%) in June 2020, up from 122 (34%) in July 2019, up from 114 (44%) in July 2018; Active Listings are at 471 compared to 533 (down 12%) at this time last year; New Listings in July were up 7% compared to June 2020, up 40% compared to July 2019 and up 35% compared to July 2018. Month’s Supply of Total Residential Listings is down to 3 Month’s Supply (Mostly Seller’s Market conditions with some areas of Balanced Market Conditions) and a Sales to Listings Ratio of 59% compared to 37% in June 2020, 61% in July 2019 and 55% in July 2018.
Coquitlam: Total Units Sold in July was 287 – up from 216 (28%) in June 2020, up from 236 (24%) in July 2019, up from 150 (30%) in July 2018; Active Listings are at 846 compared to 1,120 (down 15%) at this time last year; New Listings in July were down 6% compared to June 2020, down 2% compared to July 2019 and down 8% compared to July 2018. Month’s Supply of Total Residential Listings is down to 3 Month’s Supply (Mostly Seller’s Market conditions) and a Sales to Listings Ratio of 67% compared to 48% in June 2020, 54% in July 2019 and 32% in July 2018.
Port Moody: Total Units Sold in July was 96 – up from 59 (28%) in June 2020, up from 56 (24%) in July 2019, up from 52 (30%) in July 2018; Active Listings are at 256 compared to 236 (down 15%) at this time last year; New Listings in July were down 3% compared to June 2020, up 92% compared to July 2019 and up 32% compared to July 2018. Month’s Supply of Total Residential Listings is down to 3 Month’s Supply (Mostly Seller’s Market conditions) and a Sales to Listings Ratio of 67% compared to 40% in June 2020, 75% in July 2019 and 48% in July 2018.
Port Coquitlam: Total Units Sold in July was 119 – up from 91 (28%) in June 2020, up from 86 (24%) in July 2019, up from 84 (30%) in July 2018; Active Listings are at 238 compared to 381 (down 15%) at this time last year; New Listings in July were up 1% compared to June 2020, up 12% compared to July 2019 and down 9% compared to July 2018. Month’s Supply of Total Residential Listings is down to 2 Month’s Supply (Seller’s Market conditions) and a Sales to Listings Ratio of 70% compared to 54% in June 2020, 57% in July 2019 and 45% in July 2018.
Ladner: Total Units Sold in July was 49 – up from 38 (29%) in June 2020, up from 34 (44%) in July 2019, up from 29 (69%) in July 2018; Active Listings are at 148 compared to 190 (down 22%) at this time last year; New Listings in July were up 18% compared to June 2020, up 22% compared to July 2019 and up 64% compared to July 2018. Month’s Supply of Total Residential Listings is down to 3 Month’s Supply (Mostly Seller’s Market conditions) and a Sales to Listings Ratio of 68% compared to 62% in June 2020, 58% in July 2019 and 66% in July 2018.
Tsawwassen: Total Units Sold in July was 62 – up from 48 (29%) in June 2020, up from 46 (35%) in July 2019, up from 23 (170%) in July 2018; Active Listings are at 295 compared to 287 (up 3%) at this time last year; New Listings in July were up 10% compared to June 2020, up 80% compared to July 2019 and up 106% compared to July 2018. Month’s Supply of Total Residential Listings is down to 5 Month’s Supply (Balanced Market with strong signs of Seller’s Market conditions) and a Sales to Listings Ratio of 48% compared to 41% in June 2020, 65% in July 2019 and 37% in July 2018.
Pitt Meadows: Total Units Sold in July was 48 – up from 28 (71%) in June 2020, up from 20 (140%) in July 2019, up from 25 (92%) in July 2018; Active Listings are at 99 compared to 139 (down 28%) at this time last year; New Listings in July were up 15% compared to June 2020, up 24% compared to July 2019 and up 19% compared to July 2018. Month’s Supply of Total Residential Listings is down to 2 Month’s Supply (Mostly Seller’s Market conditions) and a Sales to Listings Ratio of 77% compared to 51% in June 2020, 40% in July 2019 and 48% in July 2018.
Maple Ridge: Total Units Sold in July was 246 – up from 189 (30%) in June 2020, up from 182 (35%) in July 2019, up from 130 (89%) in July 2018; Active Listings are at 671 compared to 870 (down 22%) at this time last year; New Listings in July were up 11% compared to June 2020, up 13% compared to July 2019 and up 34% compared to July 2018. Month’s Supply of Total Residential Listings is down to 3 Month’s Supply (Mostly Seller’s Market conditions) and a Sales to Listings Ratio of 67% compared to 57% in June 2020, 56% in July 2019 and 47% in July 2018.
Kevin Skipworth
Managing Broker/Partner/Chief Economist