
While the weather has helped to take attention away from the real estate market, we continue to see the impacts of the mortgage stress test, rate increase and government intervention on the market. Along with the natural transition from a very busy market as demand wanes and it’s not surprising to see the market down 30 per cent in sales volume. Some interesting reports show the Toronto real estate market having its first year over year increase in sales since their market slowed. That certainly could be attributed to the election result which favored the party with less demand side measures to be taken on the real estate market. A report from Mortgage Professionals Canada As is typically the case, June sales volumes were less than that of May as consumers’ attentions shift towards graduations and summer vacations. The total number of homes sold in Pro showed that the tougher mortgage qualification rules are disqualifying 18 per cent of buyers who cannot purchase their preferred home even though they could afford it. That 18 per cent were among the 50 per cent of all homes buyers in the first half of the year. The report went on to say that most of those buyers still purchased but went on to purchase but had to buy lesser expensive homes.
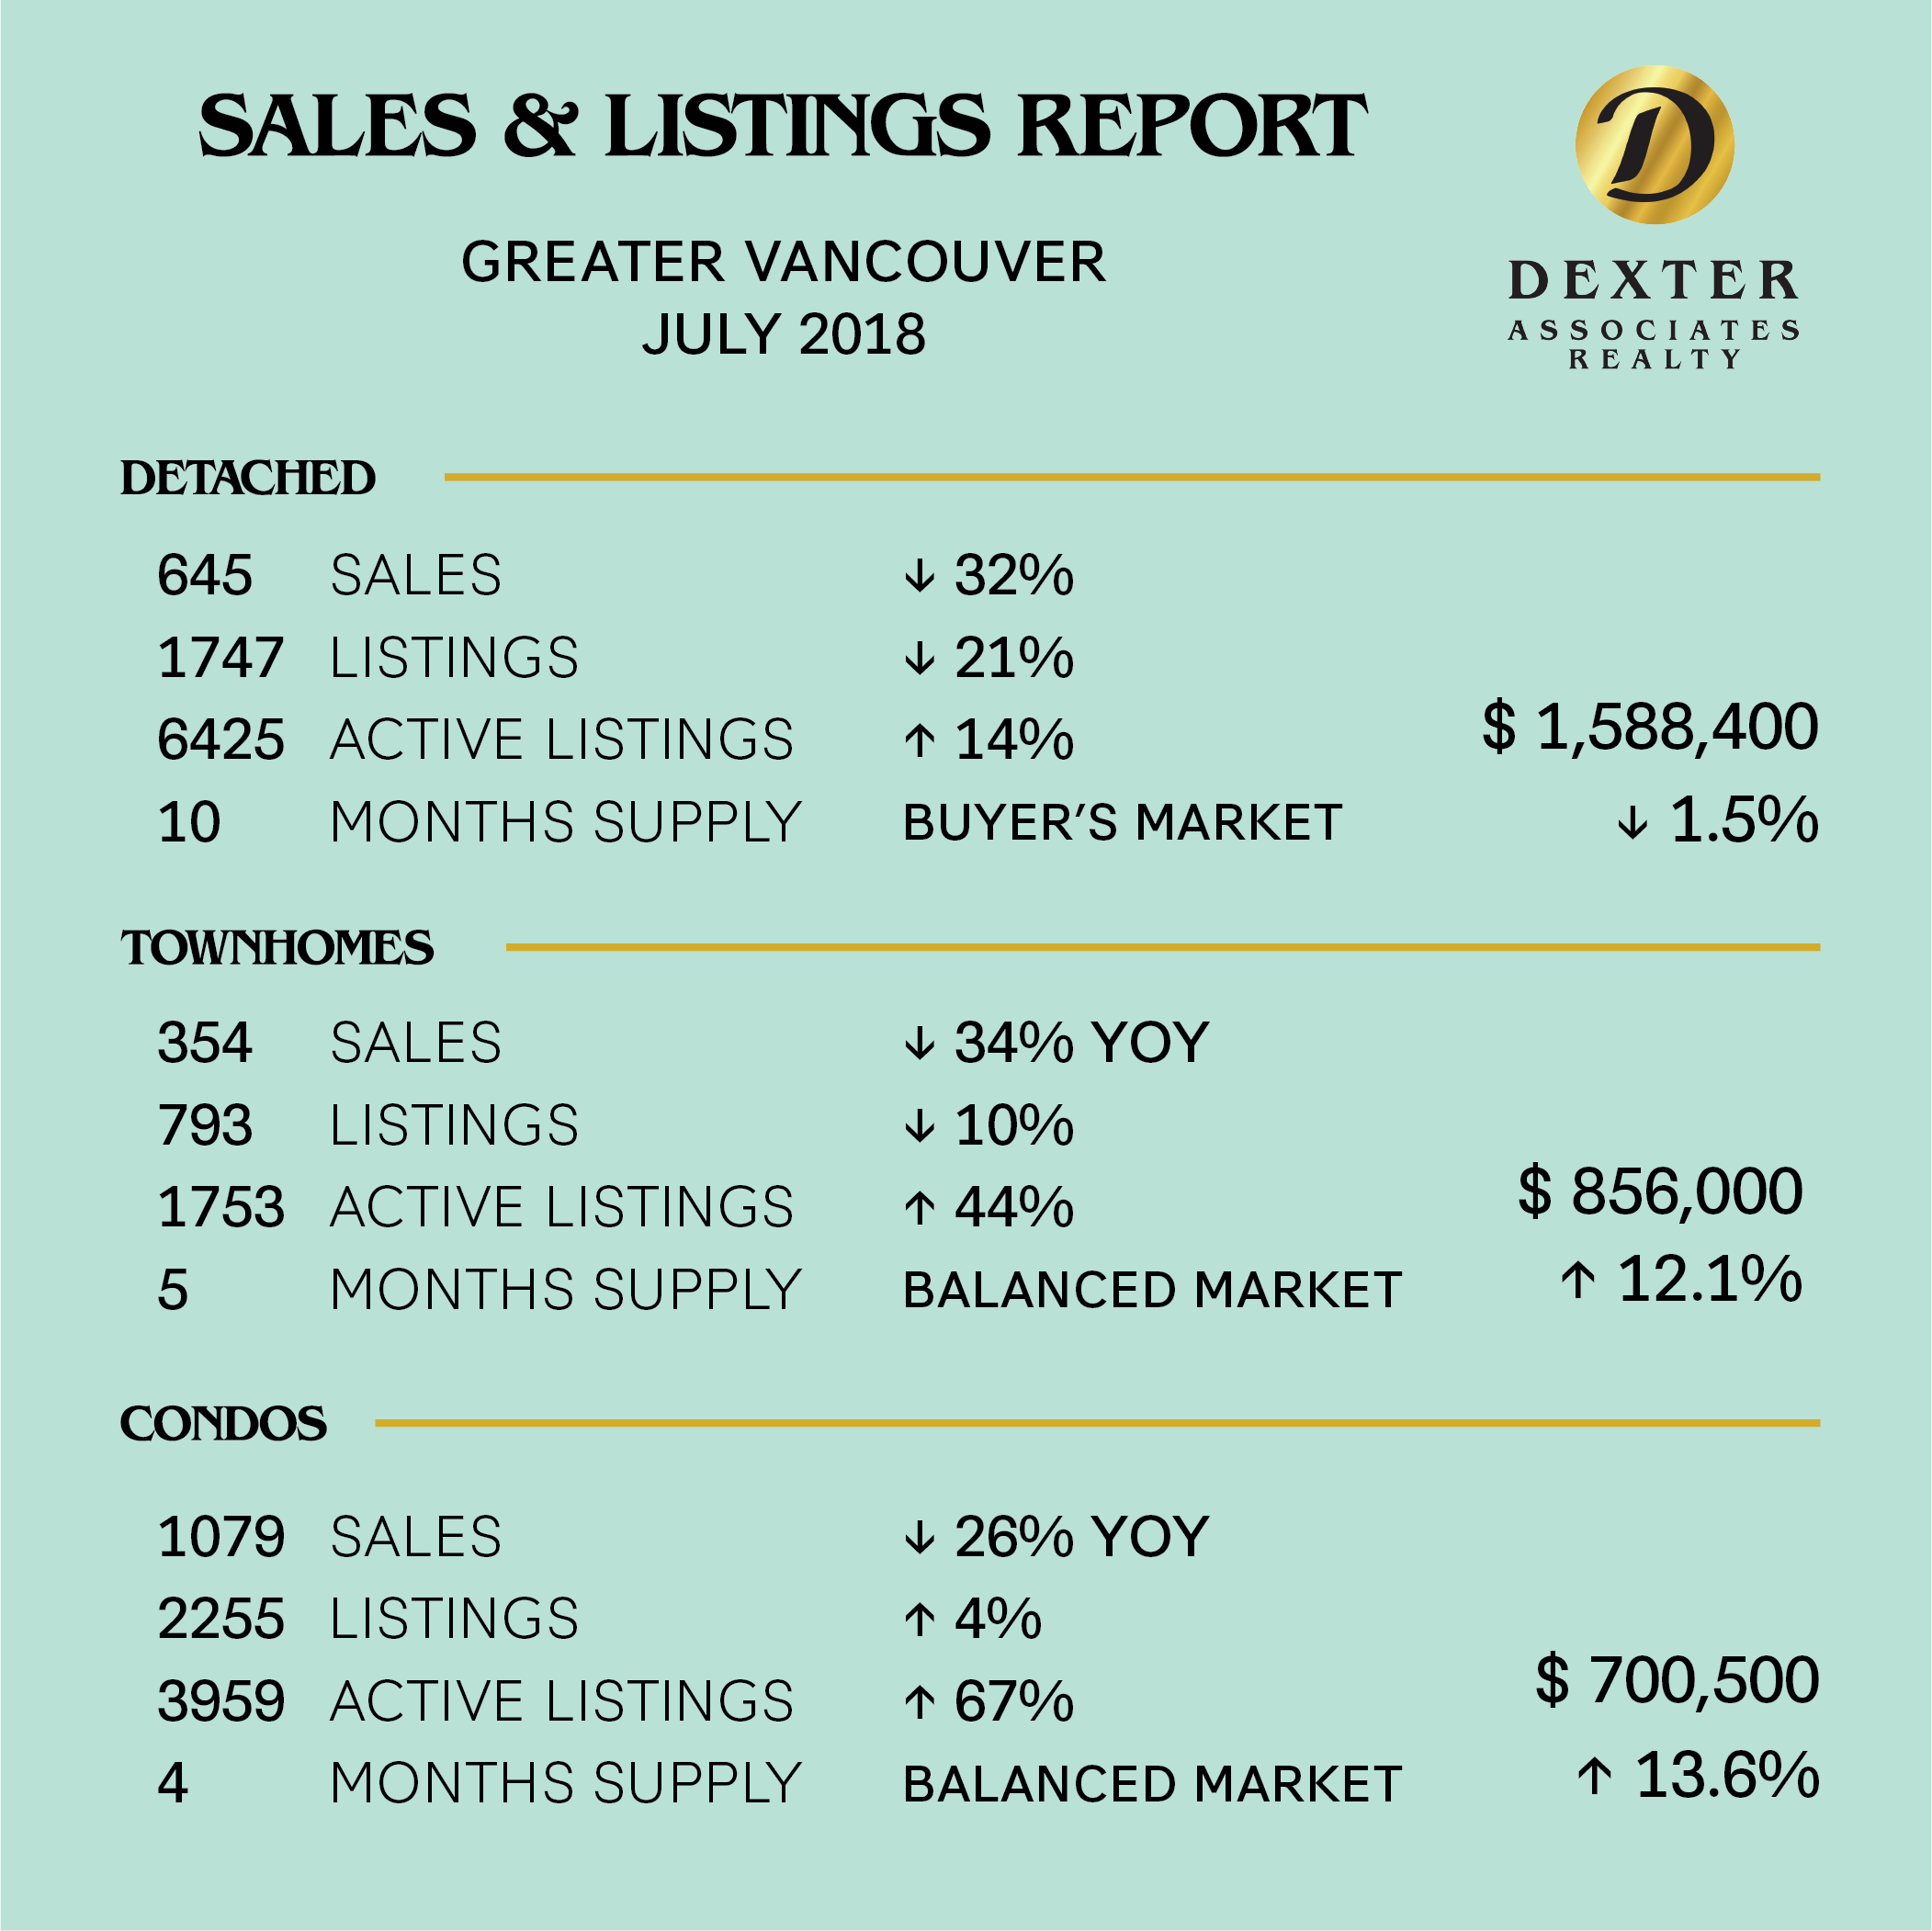
There were 2,108 homes sold of all types in Greater Vancouver in July this year compared with 3,102 sales in July last year and 3,301 homes sold in July 2016. This was 33 per cent below the 10 year average for July and the lowest amount of sales in July since 2000. In fact, 1998 to 2000 saw some of the lowest amounts for sales in the month of July (1,758 in 2000, 2,217 in 1999 and 1,860 in 1998). Coincidentally the last three years of the NDP Government before the Liberals took over in 2001. While July is typically a slower month for sales on average, this year is certainly showing similar results when looking at monthly sales compared to 2017. There were 645 Detached Houses sold in July 2018 down from 771 (down 16 per cent) in June in Greater Vancouver, but down from 954 in July 2017. For townhouses there were 354 sales in July 2018 compared to 419 in June (down 13 per cent) and for condos there were 1,079 sales in July, a decrease in sales from 1,240 in June (down 15 per cent) and compared to 1,468 in July 2017.
As for supply in the market, there was a decrease in the amount of new listings in July compared to last month. There were 4,896 new listings in July in Greater Vancouver, down 9 per cent from July last year and down 8 per cent from July 2016. The amount of new listings in July 2018 were 4 per cent below the 10 year average for July. Active Listings are at 12,848 for month end (up 30 per cent compared to July 2017). While the rise of active listings continued in July, the rate of growth slowed has slowed much more compared to previous months, keeping Active Listings below 13,000. August will continue to be slow for new listings with Active Listings likely to drop by the end of the month.
“With fewer buyers active in today’s market, we’re seeing less upward pressure on home prices across the region,” Phil Moore, Real Estate Board of Greater Vancouver president said. “This is most pronounced in the detached home market, but demand in the townhome and apartment markets is also relenting from the more frenetic pace experienced over the last few years. Summer is traditionally a quieter time of year in real estate. This is particularly true this year,” Moore said. “With increased mortgage rates and stricter lending requirements, buyers and sellers are opting to take a wait-and-see approach for the time being.”
East of the Fraser River, the Fraser Valley Real Estate Board processed 1,290 sales of all property types on its Multiple Listing Service® in July, a decrease of 33.4 per cent compared to 1,937 sales in July of last year, and a 11.2 per cent decrease compared to the 1,452 sales in June 2018. Of the 1,290 sales processed last month 346 were townhouses and 337 were apartments, together representing 53 per cent of all transactions in July, a slightly bigger share of the market compared to June. Active inventory for the Fraser Valley finished at 7,399, increasing 3.6 per cent month-over-month and 23.9 per cent when compared to July 2017. “Despite a much healthier level of inventory, demand continues to be influenced by pricing and market barriers such as the mortgage stress test and rising interest rates,” said John Barbisan, Board President. “On top of that, summer is busy for people and usually a slow season for real estate.”
Here’s a summary of the numbers:
Greater Vancouver: Total Units Sold in July 2018 was 2,108 – down from 2,467 (15%) in June 2018, down from 3,012 (30%) in July 2017, down from 3,301 (37%) in July 2016; Active Listings are at 12,848 compared to 9,869 (up 30%) at this time last year; New Listings in July 2018 were down 9% compared to July 2017 and down 9% compared to July 2016; Month’s Supply of Total Residential Listings is up to 6 Month’s Supply (Balanced to Buyer’s Market with Attached shifting to Balanced Market conditions) and a Sales to Listings Ratio of 43% compared to 56% in July 2017.
Vancouver Westside Residential: Total Units Sold in July 2018 was 403 – down from 458 (12%) in June 2018, down from 525 (23%) in July 2017, down from 604 (33%) in July 2016; Active Listings are at 2,272 compared to 1,705 (up 33%) at this time last year; New Listings in July 2018 were down 10% compared to July 2017 and down 13% compared to July 2016; Month’s Supply of Total Residential Listings is up to 6 Month’s Supply (Balanced to Buyer’s Market with Attached shifting to Balanced Market conditions) and a Sales to Listings Ratio of 45% compared to 53% in July 2017.
Vancouver Eastside Residential: Total Units Sold in July 2018 was 227 – down from 282 (20%) in June 2018, down from 307 (26%) in July 2017, down from 290 (22%) in July 2016; Active Listings are at 1,391 compared to 1,135 (up 23%) at this time last year; New Listings in July 2018 were down 15% compared to July 2017 and up 1% compared to July 2016; Month’s Supply of Total Residential Listings is up to 6 Month’s Supply (Balanced to Buyer’s Market with Attached shifting to Balanced Market conditions) and a Sales to Listings Ratio of 42% compared to 56% in July 2017.
North Vancouver Residential: Total Units Sold in July 2018 was 153 – down from 199 (23%) in June 2018, down from 200 (23%) in July 2017, down from 240 (36%) in July 2016; Active Listings are at 794 compared to 554 (up 43%) at this time last year; New Listings in July 2018 were down 10% compared to July 2017 and down 10% compared to July 2016; Month’s Supply of Total Residential Listings is up to 5 Month’s Supply (Balanced to Buyer’s Market with Attached shifting to Balanced Market conditions) and a Sales to Listings Ratio of 47% compared to 55% in July 2017.
West Vancouver Houses: Total Units Sold in July 2018 was 57 – up from 54 (5%) in June 2018, up from 56 (2%) in July 2017, down from 67 (15%) in July 2016; Active Listings are at 740 compared to 585 (up 33%) at this time last year; New Listings in July 2018 were down 1% compared to July 2017 and down 13% compared to July 2016; Month’s Supply of Total Residential Listings is down to 13 Month’s Supply (Buyer’s Market) and a Sales to Listings Ratio of 33% compared to 32% in July 2017.
Richmond Residential: Total Units Sold in July 2018 was 284 – down from 308 (8%) in June 2018, down from 404 (30%) in July 2017, down from 433 (34%) in July 2016; Active Listings are at 1,809 compared to 1,435 (up 26%) at this time last year; New Listings in July 2018 were down 20% compared to July 2017 and down 15% compared to July 2016; Month’s Supply of Total Residential Listings is steady at 6 Month’s Supply (Balanced to Buyer’s Market with Attached shifting to Balanced Market conditions) and a Sales to Listings Ratio of 44% compared to 50% in July 2017.
Burnaby East: Total Units Sold in July 2018 was 21 – down from 22 (19%) in June 2018, down from 31 (33%) in July 2017, down from 32 (35%) in July 2016; Active Listings are at 138 compared to 104 (up 33%) at this time last year; New Listings in July 2018 were down 8% compared to July 2017 and down 13% compared to July 2016; Month’s Supply of Total Residential Listings is up to 7 Month’s Supply (Balanced to Buyer’s Market with Attached shifting to Balanced Market conditions) and a Sales to Listings Ratio of 38% compared to 52% in July 2017.
Burnaby North: Total Units Sold in July 2018 was 88 – down from 107 (18%) in June 2018, down from 124 (29%) in July 2017, down from 165 (47%) in July 2016; Active Listings are at 476 compared to 406 (up 17%) at this time last year; New Listings in July 2018 were down 15% compared to July 2017 and down 25% compared to July 2016; Month’s Supply of Total Residential Listings is up to 5 Month’s Supply (Balanced to Buyer’s Market with Attached shifting to Balanced Market conditions) and a Sales to Listings Ratio of 42% compared to 40% in July 2017.
Burnaby South: Total Units Sold in July 2018 was 76 – down from 121 (37%) in June 2018, down from 144 (47%) in July 2017, down from 192 (60%) in July 2016; Active Listings are at 646 compared to 498 (up 30%) at this time last year; New Listings in July 2018 were down 15% compared to July 2017 and down 17% compared to July 2016; Month’s Supply of Total Residential Listings is up to 9 Month’s Supply (Balanced to Buyer’s Market) and a Sales to Listings Ratio of 29% compared to 47% in July 2017.
New Westminster: Total Units Sold in July 2018 was 114 – down from 141 (19%) in June 2018, down from 150 (24%) in July 2017, down from 154 (26%) in July 2016; Active Listings are at 385 compared to 274 (up 41%) at this time last year; New Listings in July 2018 were down 9% compared to July 2017 and up 8% compared to July 2016; Month’s Supply of Total Residential Listings is steady at 3 Month’s Supply (Balanced to Seller’s Market Conditions) and a Sales to Listings Ratio of 55% compared to 66% in July 2017.
Coquitlam: Total Units Sold in July 2018 was 150 – down from 178 (15%) in June 2018, down from 270 (45%) in July 2017, down from 293 (49%) in July 2016; Active Listings are at 979 compared to 638 (up 53%) at this time last year; New Listings in July 2018 were up 1% compared to July 2017 and up 5% compared to July 2016; Month’s Supply of Total Residential Listings is up to 7 Month’s Supply (Balanced to Buyer’s Market) and a Sales to Listings Ratio of 32% compared to 58% in July 2017.
Port Moody: Total Units Sold in July 2018 was 52 – up from 48 (8%) in June 2018, down from 75 (30%) in July 2017, down from 74 (30%) in July 2016; Active Listings are at 218 compared to 160 (up 36%) at this time last year; New Listings in July 2018 were down 9% compared to July 2017 and down 16% compared to July 2016; Month’s Supply of Total Residential Listings is down to 4 Month’s Supply (Balanced to Seller’s Market Conditions in Attached) and a Sales to Listings Ratio of 48% compared to 63% in July 2017.
Port Coquitlam: Total Units Sold in July 2018 was 84 – down from 108 (22%) in June 2018, down from 120 (30%) in July 2017, down from 138 (39%) in July 2016; Active Listings are at 330 compared to 182 (up 81%) at this time last year; New Listings in July 2018 were up 9% compared to July 2017 and down 1% compared to July 2016; Month’s Supply of Total Residential Listings is up to 4 Month’s Supply (Balanced to Seller’s Market Conditions in Attached) and a Sales to Listings Ratio of 45% compared to 70% in July 2017.
Ladner: Total Units Sold in July 2018 was 29 – down from 38 (24%) in June 2018, down from 46 (37%) in July 2017, down from 57 (41%) in July 2016; Active Listings are at 164 compared to 128 (up 28%) at this time last year; New Listings in July 2018 were down 19% compared to July 2017 and down 12% compared to July 2016; Month’s Supply of Total Residential Listings is up to 6 Month’s Supply (Balanced to Buyer’s Market with Attached shifting to Balanced Market conditions) and a Sales to Listings Ratio of 66% compared to 85% in July 2017.
Tsawwassen: Total Units Sold in July 2018 was 23 – down from 42 (45%) in June 2018, down from 43 (47%) in July 2017, down from 38 (39%) in July 2016; Active Listings are at 253 compared to 187 (up 35%) at this time last year; New Listings in July 2018 were down 18% compared to July 2017 and up 11% compared to July 2016; Month’s Supply of Total Residential Listings is up to 11 Month’s Supply (Buyer’s Market conditions) and a Sales to Listings Ratio of 37% compared to 57% in July 2017.
Kevin Skipworth
Dexter Associates Realty
Partner/Broker