Attached are the Sales and Listings Stats updated to the end of October 2018. Two things came in October – rain and a few more sales in the market. As is the case with October, activity does increases as do the number of new listings.
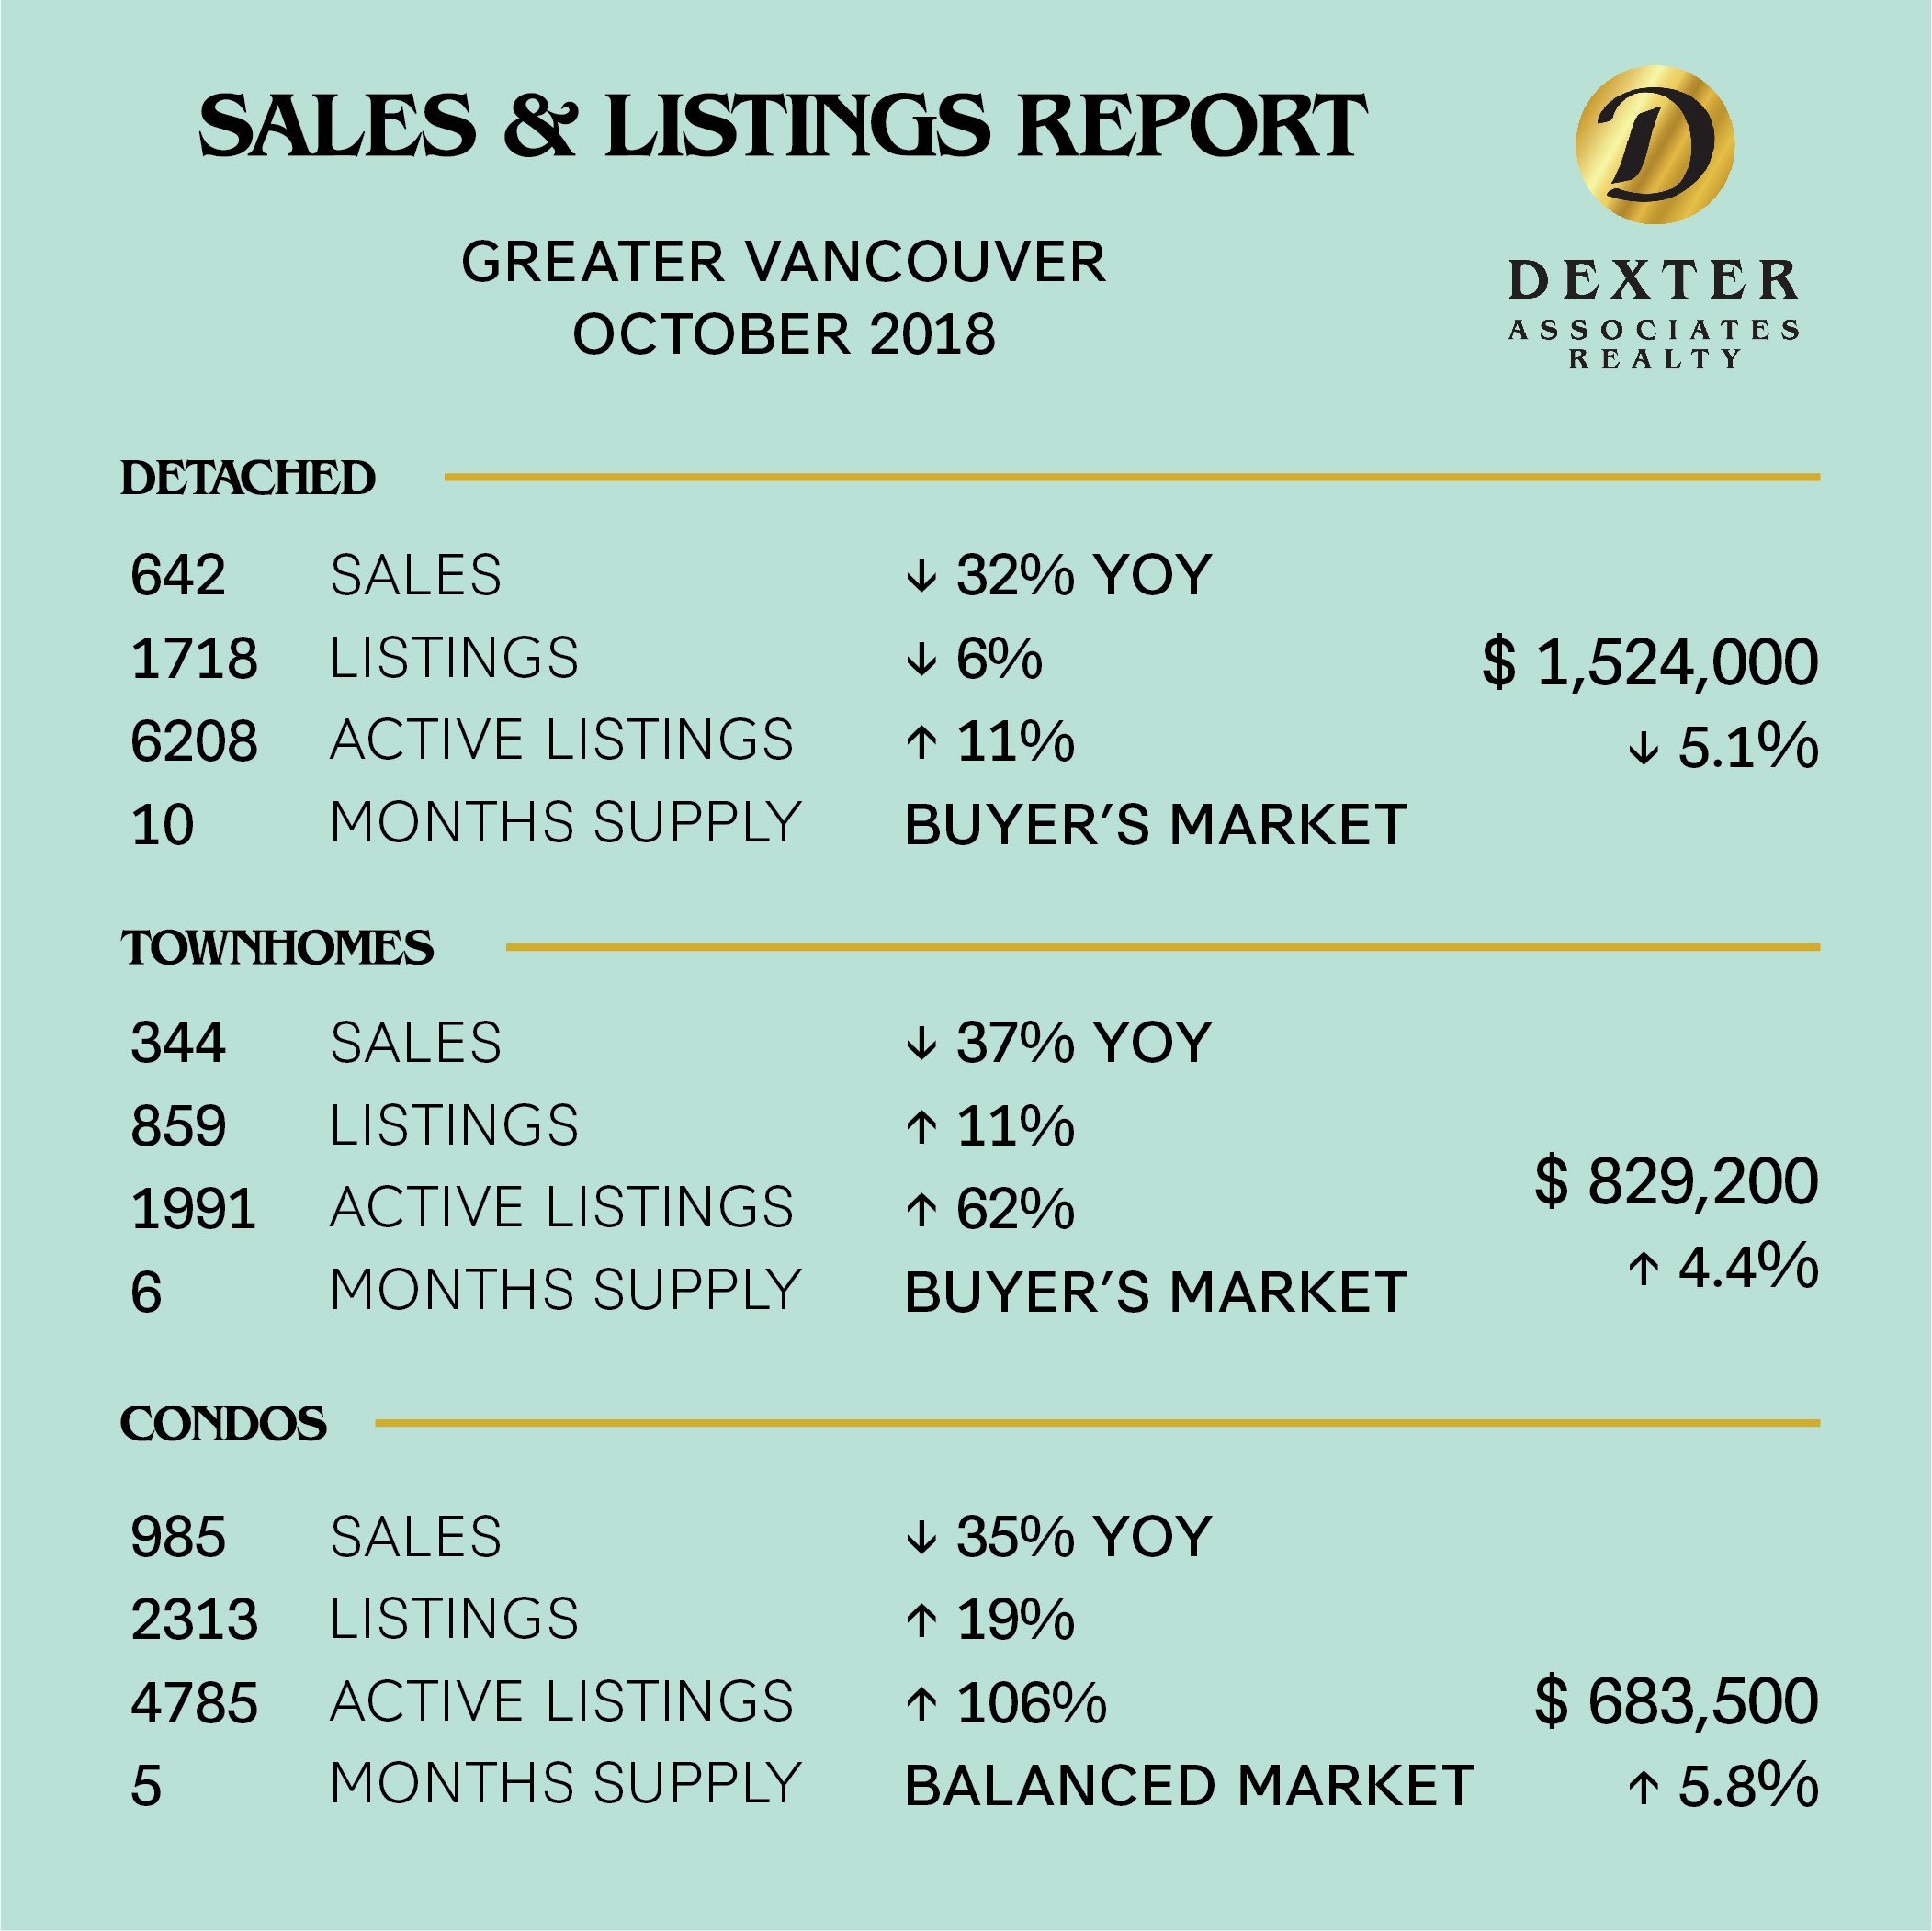
There were 1,995 homes sold of all types in Greater Vancouver in October this year compared with 3,073 sales in October last year and 2,284 homes sold in October 2016. This was 27 per cent below the 10 year average for October and almost the same level as October 2012 at 1,979. In fact, when we look at 2012, so far, each month has tracked very similar for sales levels. With the main difference being the inventory levels. – much lower than in 2012. There continues to be a hesitation in the market right now While prices on the detached side of the market have been falling over the last year, we are now seeing this occur in the apartment and townhouse market in some areas and product types. There were 642 Detached Houses sold in October 2018 down from 945 (down 38 per cent) in October 2017 in Greater Vancouver, and down from 659 in October 2016. For townhouses there were 344 sales in October 2018 compared to 550 in October 2017 (down 37 per cent), down from 403 October 2016 and for condos there were 985 sales in October 2018, a decrease in sales from 1,532 in October 2017 (down 36 per cent) and compared to 1,178 in September 2016. Overall there has been an increase in market activity for October compared to November as we typically see. Although the bigger increases in homes sold has been in Vancouver, North Vancouver and West Vancouver. Ladner actually saw less sales in October compared to September and areas like Burnaby, New Westminster and the Tri-Cities saw lower per centage gains in comparison. The average prices in those areas also dropped while Vancouver saw a gain.
As for supply in the market, there was an increase in the number of new listings in October compared to October of last year. There were 5,026 new listings in October in Greater Vancouver, up 8 per cent from October last year and up from 4,066 or 23 per cent from October 2016. The number of new listings in September 2018 were just above the 11 year average for September. Active Listings are at 13,682 for month end (up 36 per cent compared to October). Active Listings fell from 13,760 in September 2018 and will continue to do so as the year finishes. At the end of October 2012, the Active Listing count was 18,519 – 35 per cent higher than in today’s market. A significant difference from the last down market and indicative of strength in the market overall.
“The supply of homes for sale today is beginning to return to levels that we haven’t seen in our market in about four years,” Phil Moore, Real Estate Board of Greater Vancouver president said. “For home buyers, this means you have more selection to choose from. For sellers, it means your home may face more competition, from other listings, in the marketplace. Home prices have edged down between three and fiver per cent, depending on housing type, in our region since June. This is providing a little relief for those looking to buy compared to the all-time highs we’ve experienced over the last year.
East of the Fraser River, the Fraser Valley Real Estate Board processed 1,155 sales of all property types on its Multiple Listing Service® in October, a decrease of 36 per cent compared to 1,779 sales in October of last year, and a 12 per cent increase compared to sales in September 2018. Of the 1,155 sales processed last month 306 were townhouses and 292 were apartments and 438 were detached homes. While slight, this is the first time since May that sales here have been on the upswing,” said John Barbisan, Board President. “We’re beneath typical activity levels for this time of year but it’s good to see that buyers and sellers are still finding success this season.”
Here’s a summary of the numbers:
Greater Vancouver: Total Units Sold in October 2018 was 1,995 – up from 1,634 (22%) in September 2018, down from 3,073 (35%) in October 2017, down from 2,284 (13%) in October 2016; Active Listings are at 13,682 compared to 9,768 (up 40%) at this time last year; New Listings in October 2018 were up 8% compared to October 2017 and up 24% compared to October 2016; Month’s Supply of Total Residential Listings is down to 7 Month’s Supply (Buyer’s Market) and a Sales to Listings Ratio of 40% compared to 66% in October 2017.
Vancouver Westside Residential: Total Units Sold in October 2018 was 381 – up from 280 (36%) in September 2018, down from 556 (31%) in October 2017, down from 408 (7%) in October 2016; Active Listings are at 2,459 compared to 1,725 (up 43%) at this time last year; New Listings in October 2018 were up 10% compared to October 2017 and up 35% compared to October 2016; Month’s Supply of Total Residential Listings is down to 6 Month’s Supply (Buyer’s Market) and a Sales to Listings Ratio of 37% compared to 60% in October 2017.
Vancouver Eastside Residential: Total Units Sold in October 2018 was 234 – up from 195 (20%) in September 2018, down from 298 (21%) in October 2017, up from 202 (16%) in October 2016; Active Listings are at 1,409 compared to 1,168 (up 21%) at this time last year; New Listings in October 2018 were down 5% compared to October 2017 and up 6% compared to October 2016; Month’s Supply of Total Residential Listings is down to 6 Month’s Supply (Buyer’s Market) and a Sales to Listings Ratio of 44% compared to 54% in October 2017.
North Vancouver Residential: Total Units Sold in October 2018 was 173 – up from 120 (44%) in September 2018, down from 250 (31%) in October 2017, up from 170 (2%) in October 2016; Active Listings are at 938 compared to 604 (up 55%) at this time last year; New Listings in October 2018 were up 15% compared to October 2017 and up 50% compared to October 2016; Month’s Supply of Total Residential Listings is down to 5 Month’s Supply (Balanced Market) and a Sales to Listings Ratio of 37% compared to 61% in October 2017.
West Vancouver Houses: Total Units Sold in October 2018 was 55 – up from 34 (62%) in September 2018, up from 46 (20%) in October 2017, up from 35 (57%) in October 2016; Active Listings are at 743 compared to 652 (up 14%) at this time last year; New Listings in October 2018 were up 6% compared to October 2017 and up 48% compared to October 2016; Month’s Supply of Total Residential Listings is down to 14 Month’s Supply (Buyer’s Market) and a Sales to Listings Ratio of 26% compared to 23% in October 2017.
Richmond Residential: Total Units Sold in October 2018 was 230 – up from 196 (17%) in September 2018, down from 411 (44%) in October 2017, down from 290 (20%) in October 2016; Active Listings are at 1,878 compared to 1,408 (up 33%) at this time last year; New Listings in October 2018 were down 6% compared to October 2017 and up 15% compared to October 2016; Month’s Supply of Total Residential Listings is down to 8 Month’s Supply (Buyer’s Market) and a Sales to Listings Ratio of 39% compared to 66% in October 2017.
Burnaby East: Total Units Sold in October 2018 was 17 – up from 11 (54%) in September 2018, down from 22 (45%) in October 2017, down from 22 (45%) in October 2016; Active Listings are at 148 compared to 127 (up 17%) at this time last year; New Listings in October 2018 were down 13% compared to October 2017 and up 8% compared to October 2016; Month’s Supply of Total Residential Listings is down to 9 Month’s Supply (Buyer’s Market) and a Sales to Listings Ratio of 33% compared to 37% in October 2017.
Burnaby North: Total Units Sold in October 2018 was 76 – down from 83 (8%) in September 2018, down from 161 (53%) in October 2017, down from 121 (40%) in October 2016; Active Listings are at 556 compared to 383 (up 45%) at this time last year; New Listings in October 2018 were up 28% compared to October 2017 and up 26% compared to October 2016; Month’s Supply of Total Residential Listings is down to 7 Month’s Supply (Buyer’s Market) and a Sales to Listings Ratio of 30% compared to 82% in October 2017.
Burnaby South: Total Units Sold in October 2018 was 87 – up from 82 (6%) in September 2018, down from 184 (53%) in October 2017, down from 103 (16%) in October 2016; Active Listings are at 693 compared to 450 (up 54%) at this time last year; New Listings in October 2018 were up 25% compared to October 2017 and up 57% compared to October 2016; Month’s Supply of Total Residential Listings is steady at 8 Month’s Supply (Buyer’s Market) and a Sales to Listings Ratio of 31% compared to 81% in October 2017.
New Westminster: Total Units Sold in October 2018 was 88 – up from 81 (9%) in September 2018, down from 152 (53%) in October 2017, down from 106 (17%) in October 2016; Active Listings are at 511 compared to 282 (up 81%) at this time last year; New Listings in October 2018 were up 22% compared to October 2017 and up 62% compared to October 2016; Month’s Supply of Total Residential Listings is steady at 6 Month’s Supply (Buyer’s Market) and a Sales to Listings Ratio of 36% compared to 77% in October 2017.
Coquitlam: Total Units Sold in October 2018 was 136 – up from 131 (4%) in September 2018, down from 248 (55%) in October 2017, down from 183 (26%) in October 2016; Active Listings are at 1,026 compared to 662 (up 55%) at this time last year; New Listings in October 2018 were up 9% compared to October 2017 and up 18% compared to October 2016; Month’s Supply of Total Residential Listings is steady at 8 Month’s Supply (Buyer’s Market) and a Sales to Listings Ratio of 37% compared to 73% in October 2017.
Port Moody: Total Units Sold in October 2018 was 36 – up from 34 (6%) in September 2018, down from 76 (53%) in October 2017, down from 65 (45%) in October 2016; Active Listings are at 242 compared to 160 (up 51%) at this time last year; New Listings in October 2018 were down 30% compared to October 2017 and down 20% compared to October 2016; Month’s Supply of Total Residential Listings is steady at 7 Month’s Supply (Buyer’s Market) and a Sales to Listings Ratio of 51% compared to 75% in October 2017.
Port Coquitlam: Total Units Sold in October 2018 was 75 – up from 73 (3%) in September 2018, down from 120 (37%) in October 2017, down from 93 (19%) in October 2016; Active Listings are at 357 compared to 170 (up 110%) at this time last year; New Listings in October 2018 were up 23% compared to October 2017 and up 9% compared to October 2016; Month’s Supply of Total Residential Listings is steady at 5 Month’s Supply (Balanced Market) and a Sales to Listings Ratio of 46% compared to 91% in October 2017.
Ladner: Total Units Sold in October 2018 was 21 – down from 30 (30%) in September 2018, down from 31 (33%) in October 2017, down from 27 (23%) in October 2016; Active Listings are at 187 compared to 121 (up 55%) at this time last year; New Listings in October 2018 were up 29% compared to October 2017 and down 3% compared to October 2016; Month’s Supply of Total Residential Listings is up to 9 Month’s Supply (Buyer’s Market) and a Sales to Listings Ratio of 32% compared to 61% in October 2017.
Tsawwassen: Total Units Sold in October 2018 was 25 – the same as September 2018, down from 40 (37%) in October 2017, up from 24 (24%) in October 2016; Active Listings are at 230 compared to 179 (up 28%) at this time last year; New Listings in October 2018 were up 6% compared to October 2017 and up 36% compared to October 2016; Month’s Supply of Total Residential Listings is down to 9 Month’s Supply (Buyer’s Market) and a Sales to Listings Ratio of 37% compared to 63% in October 2017.
Kevin Skipworth
Dexter Realty
Partner/Broker