Dexter Report - Greater Vancouver Market Report - Sept 15th 2020


“A tiny change today brings a dramatically different tomorrow.” Richard Bach
There seemed to be more competition in the real estate market than in the National Hockey League this August – who ever thought that would be a comparison for this time of year. If we thought competing offers were a constant in July, after a tempered start in the first half of August, we experienced two weeks with the most amount of sales reported this year after that. Amid all the chatter of economic disruption and its potential negative effects on the housing market, real estate has taken on a life of its own and clearly wants nothing to do with slowing down. And guess what? – it’s local! All the while buyers vying for various types of properties in different areas are walking away from competing offers still looking for their home. Demand side measures haven’t eased the burden for buyers in Metro Vancouver and supply continues to be an issue.
There were 3,122 properties sold of all types in Greater Vancouver in August this year compared with 3,202 sold in July, 2,256 sales in August last year and 1,961 sold in August 2018. It was actually the sixth highest amount of sales for the month of August on record in Greater Vancouver and the highest monthly sales for August since 2015. This is not just COVID pent up demand, it is a housing market that had been stalled in 2018 and 2019 coming to life. And coming to life with a significant surge as a result of homeowners looking to trade homes and many buyers simply wanting to engage after holding back.
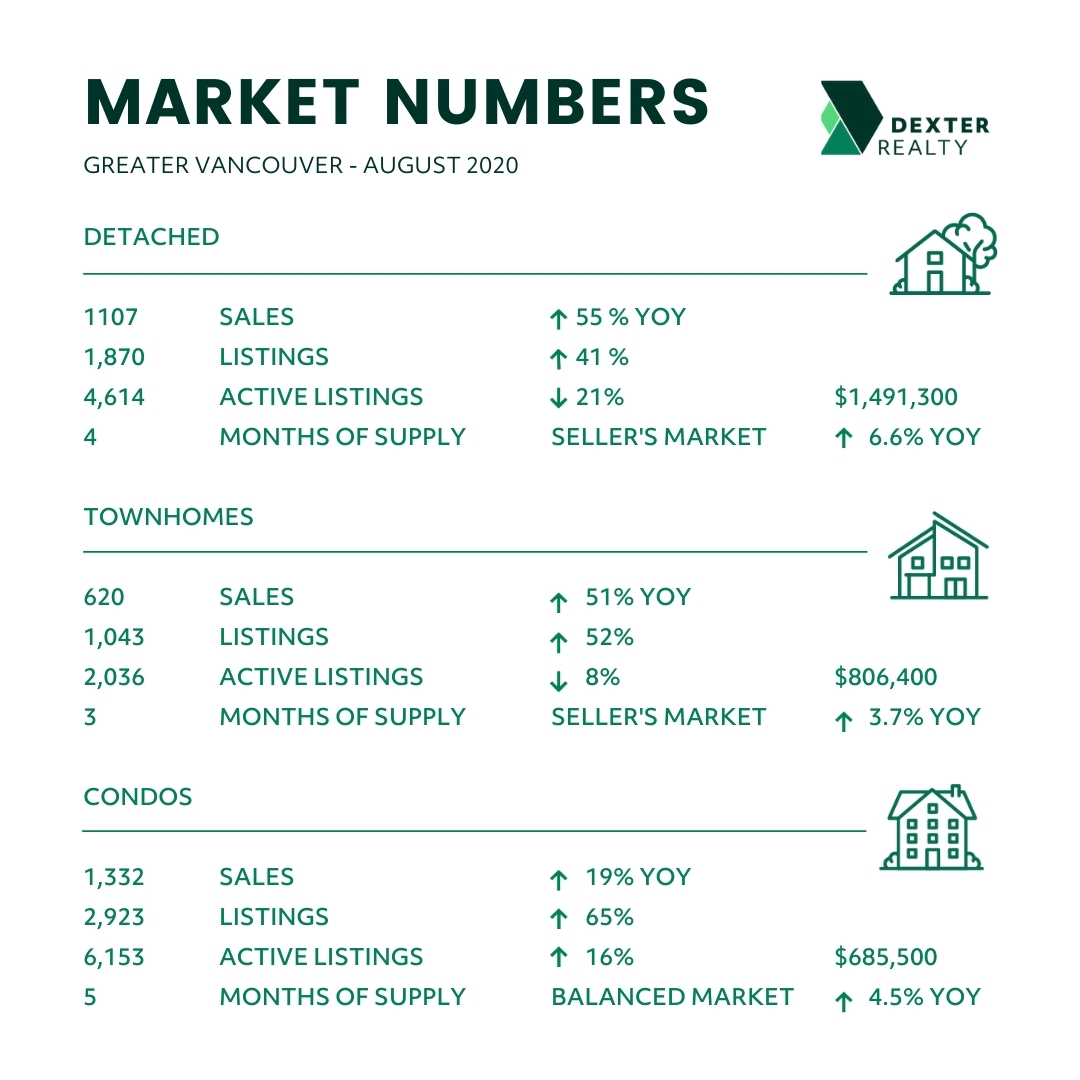
Total sales in August were 21 per cent above the ten-year average for the month. Looking at the different types of properties, detached home sales were up 55 per cent year over year, townhouses up 51 per cent year over year, apartments up 19 per cent year over year. Detached homes made up 35 per cent of all sales, while townhomes made up 20 per cent and apartments 43 per cent. While total active listings for apartments are up 16 per cent year over year, and active listings for townhouse and detached homes are down 8 per cent and 21 per cent respectively year over year, let’s not fall into the thinking that apartments are the unwanted product. The flight from apartments broadcast by some has just happened at a quicker pace, as it has always been a part of the buying cycle. While some buyers are looking for space due to working at home or wanting less shared common space, many would have made this move eventually regardless of COVID-19. Record low interest rates and over two years of down markets with price declines in the detached market have given buyers opportunities they have been itching for. After all, it’s the ultimate home owners dream, a plot of land where you live. We shouldn’t be so surprised to see this movement right now. But with more apartments available for sale comes opportunities for first time buyers and those looking for this type of property given they have been a scarce commodity over the last few years.
Average Daily Sales and Listings in Greater Vancouver
First two weeks of March – 253 new listings, 138 sales
Last two week of March – 167 New Listings, 98 Sales
April – 120 new listings, 56 sales
May – 189 new listings, 75 sales
June – 274 new listings, 115 sales
July 6 to 10 – 302 new listings, 138 sales
July 13 to 17 – 294 new listings, 146 sales
July 20 to 24 – 258 new listings, 151 sales
July 27 to 31 – 245 new listings, 154 sales
August 4 to 7 – 337 new listings, 151 sales
August 10 to 14 – 282 new listings, 140 sales
August 17 to 21 – 298 new listings, 171 sales*
August 24 to 28 – 279 new listings, 164 sales *
*the two highest weekly sales figures in 2020 including pre-pandemic
Some highlights from August:
Vancouver West and Burnaby were the only areas in Greater Vancouver to see the number of sales in August higher than July
North Vancouver detached home sales which are traditionally low in August were higher than July and 61 per cent higher than August 2019 and 232 per cent higher than August 2018
In the Pitt Meadows market, there is only one-month supply of detached homes and townhomes currently
Bowen Island and Vancouver East detached homes have seen the biggest year-over-year increase in house prices at 11.8% and 10.1% respectively (House Price Index)
There was an increase in the number of new listings in August, which was 34 per cent higher than the ten-year average for the month of August. As a result, at the end of August there were 13,511 properties for sale, compared to 12,796 at the end of July but still less than the 14,191 available at the end of August 2019 – a 5 per cent reduction in the number of homes available year-over-year. Yes, there have been more properties listed in the last few months than we typically see at this time of year and the total number of active listings have increased, but competing offers continue – houses, townhouses and apartments. Imagine what it would be like for buyers without the number of new listings we’ve seen in the last few months. Even with more homes available for sale it is very much a seller’s market in most areas, some more extreme than others. Vancouver and surrounding cities with 4 to 5 months supply of homes available while further out there are only 3 months supply available.
So now that we’ve caught up from the summer market, it’s time for the fall market. Interest rates will fuel the real estate while they remain low, but there’s no reason to think the continued availability of listings as they continue to come to market will also fuel real estate sales. There will be further movement by homeowners looking for their “more ideal” home, changes needed as a result of additions to families and unfortunately also the break down of families. And while there have been job losses, many who have been working have decreased their discretionary spending. Vacations and dinners out could turn into more equity to invest in the next home or first home.
“People who put their home buying and selling plans on hold in the spring have been returning to the market throughout the summer. Low interest rates and limited overall supply of homes for sale are creating competition in today’s housing market,” Colette Gerber, REBGV Chair said, “Like everything else in our lives these days, the uncertainty of COVID-19 presents makes it challenging to predict what will happen this fall.”
East of Vancouver, the Fraser Valley Real Estate Board processed 2,039 sales of all property types on its Multiple Listing Service® in August, a decrease of 2.9 per cent compared to sales in July but a 57.2 per cent increase compared to the 1,297 sales in August of last year. Last month’s sales were 39 per cent above the ten-year average for August and the highest August sales in a decade. There were 3,309 new listings in August, a 6.8 per cent decrease compared to July and a 40.4 per cent increase compared to August of last year. July’s new listings were 28.9 per cent above the ten-year average for the month and the highest in the last ten years. July finished with 7,404 active listings, an increase of 0.9 per cent compared to July’s inventory and a decrease of 7.9 per cent year-over-year. “We are seeing better sales volumes increase month over month because buyers are recognizing that the Fraser Valley offers increased choice and diversified housing opportunities, while offering more value as well,” Chris Shields, President of the Fraser Valley Real Estate Board said. “In an unusual situation given the pandemic, we remain cautiously optimistic and are encouraged by the numbers we are seeing.”
Here is a summary of the activity so far:
Greater Vancouver: Total Units Sold in August was 3,122 – down from 3,202 (2%) in July 2020, up from 2,256 (38%) in August 2019, up from 1,961 (59%) in August 2018; Active Listings are at 13,511 compared to 14,191 (down 5%) at this time last year; New Listings in August were down 2% compared to July 2020, up 55% compared to August 2019 and up 50% compared to August 2018. Month’s Supply of Total Residential Listings is up to 5 Month’s Supply (Balanced Market with strong signs of Seller’s Market conditions) and a Sales to Listings Ratio of 52% compared to 52% in July 2020, 59% in August 2019 and 49% in August 2018. Year-over-year, the House Price Index is up 5.3%.
Vancouver Westside: Total Units Sold in August was 490 – up from 472 (4%) in July 2020, up from 423 (16%) in August 2019, up from 371 (32%) in August 2018; Active Listings are at 2,671 compared to 2,326 (up 15%) at this time last year; New Listings in August were down 1% compared to July 2020, up 88% compared to August 2019 and up 66% compared to August 2018. Month’s Supply of Total Residential Listings is at 5 Month’s Supply (Balanced Market with strong signs of Seller’s Market conditions) and a Sales to Listings Ratio of 41% compared to 39% in July 2020, 67% in August 2019 and 51% in August 2018. Year-over-year, the House Price Index is up 5.6%.
Vancouver East Side: Total Units Sold in August was 330 – down from 344 (2%) in July 2020, up from 235 (38%) in August 2019, up from 191 (59%) in August 2018; Active Listings are at 1,319 compared to 1,233 (down 5%) at this time last year; New Listings in August were up 6% compared to July 2020, up 104% compared to August 2019 and up 86% compared to August 2018. Month’s Supply of Total Residential Listings is up to 4 Month’s Supply (Balanced Market with strong signs of Seller’s Market conditions) and a Sales to Listings Ratio of 45% compared to 50% in July 2020, 65% in August 2019 and 48% in August 2018. Year-over-year, the House Price Index is up 7.9%.
North Vancouver: Total Units Sold in August was 250 – down from 267 (6%) in July 2020, up from 184 (36%) in August 2019, up from 131 (91%) in August 2018; Active Listings are at 913 compared to 838 (up 9%) at this time last year; New Listings in August were down 1% compared to July 2020, up 86% compared to August 2019 and up 91% compared to August 2018. Month’s Supply of Total Residential Listings is up to 4 Month’s Supply (Balanced Market with strong signs of Seller’s Market conditions) and a Sales to Listings Ratio of 51% compared to 54% in July 2020, 70% in August 2019 and 51% in August 2018. Year-over-year, the House Price Index is up 7.0%.
West Vancouver: Total Units Sold in August was 67 – down from 68 (2%) in July 2020, up from 49 (38%) in August 2019, up from 46 (59%) in August 2018; Active Listings are at 667 compared to 690 (down 5%) at this time last year; New Listings in August were down 2% compared to July 2020, up 43% compared to August 2019 and up 37% compared to August 2018. Month’s Supply of Total Residential Listings is up to 10 Month’s Supply (Mostly Buyer’s Market conditions) and a Sales to Listings Ratio of 35% compared to 35% in July 2020, 36% in August 2019 and 32% in August 2018. Year-over-year, the House Price Index is up 3.7%.
Richmond: Total Units Sold in August was 340 – down from 363 (6%) in July 2020, up from 250 (36%) in August 2019, up from 266 (28%) in August 2018; Active Listings are at 1,712 compared to 2,210 (down 23%) at this time last year; New Listings in August were up 7% compared to July 2020, up 30% compared to August 2019 and up 17% compared to August 2018. Month’s Supply of Total Residential Listings is up to 5 Month’s Supply (Balanced Market with strong signs of Seller’s Market conditions) and a Sales to Listings Ratio of 51% compared to 58% in July 2020, 48% in August 2019 and 47% in August 2018. Year-over-year, the House Price Index is up 5.1%.
Burnaby East: Total Units Sold in August was 37 – up from 32 (16%) in July 2020, up from 31 (19%) in August 2019, up from 21 (4%) in August 2018; Active Listings are at 143 compared to 149 (down 4%) at this time last year; New Listings in August were down 6% compared to July 2020, up 21% compared to August 2019 and up 68% compared to August 2018. Month’s Supply of Total Residential Listings is at 4 Month’s Supply (Balanced Market with strong signs of Seller’s Market conditions) and a Sales to Listings Ratio of 58% compared to 47% in July 2020, 58% in August 2019 and 55% in August 2018. Year-over-year, the House Price Index is up 7.2%.
Burnaby North: Total Units Sold in August was 197 – up from 141 (40%) in July 2020, up from 129 (53%) in August 2019, up from 82 (140%) in August 2018; Active Listings are at 615 compared to 591 (up 4%) at this time last year; New Listings in August were up 6% compared to July 2020, up 64% compared to August 2019 and up 86% compared to August 2018. Month’s Supply of Total Residential Listings is down to 3 Month’s Supply (Balanced Market with strong signs of Seller’s Market conditions) and a Sales to Listings Ratio of 57% compared to 43% in July 2020, 61% in August 2019 and 44% in August 2018. Year-over-year, the House Price Index is up 3.5%.
Burnaby South: Total Units Sold in August was 130 – up from 114 (14%) in July 2020, up from 126 (3%) in August 2019, up from 94 (38%) in August 2018; Active Listings are at 702 compared to 792 (down 11%) at this time last year; New Listings in August were the same compared to July 2020, up 26% compared to August 2019 and up 54% compared to August 2018. Month’s Supply of Total Residential Listings is down to 5 Month’s Supply (Balanced Market with strong signs of Seller’s Market conditions) and a Sales to Listings Ratio of 42% compared to 36% in July 2020, 51% in August 2019 and 46% in August 2018. Year-over-year, the House Price Index is up 2.6%.
New Westminster: Total Units Sold in August was 161 – down from 164 (2%) in July 2020, up from 97 (66%) in August 2019, up from 90 (79%) in August 2018; Active Listings are at 504 compared to 498 (up 1%) at this time last year; New Listings in August were up 3% compared to July 2020, up 72% compared to August 2019 and up 76% compared to August 2018. Month’s Supply of Total Residential Listings is at 3 Month’s Supply (Balanced Market with strong signs of Seller’s Market conditions) and a Sales to Listings Ratio of 56% compared to 59% in July 2020, 58% in August 2019 and 56% in August 2018. Year-over-year, the House Price Index is up 4.9%.
Coquitlam: Total Units Sold in August was 246 – down from 287 (2%) in July 2020, up from 198 (38%) in August 2019, up from 183 (59%) in August 2018; Active Listings are at 872 compared to 1,059 (down 5%) at this time last year; New Listings in August were down 4% compared to July 2020, up 17% compared to August 2019 and up 12% compared to August 2018. Month’s Supply of Total Residential Listings is up to 4 Month’s Supply (Balanced Market with strong signs of Seller’s Market conditions) and a Sales to Listings Ratio of 60% compared to 67% in July 2020, 56% in August 2019 and 50% in August 2018. Year-over-year, the House Price Index is up 4.9%.
Port Moody: Total Units Sold in August was 86 – down from 96 (10%) in July 2020, up from 39 (121%) in August 2019, up from 29 (197%) in August 2018; Active Listings are at 251 compared to 226 (up 11%) at this time last year; New Listings in August were down 18% compared to July 2020, up 55% compared to August 2019 and up 111% compared to August 2018. Month’s Supply of Total Residential Listings is at 3 Month’s Supply (Balanced Market with strong signs of Seller’s Market conditions) and a Sales to Listings Ratio of 73% compared to 67% in July 2020, 51% in August 2019 and 52% in August 2018. Year-over-year, the House Price Index is up 1.2%.
Port Coquitlam: Total Units Sold in August was 103 – down from 119 (13%) in July 2020, up from 79 (30%) in August 2019, up from 72 (43%) in August 2018; Active Listings are at 258 compared to 338 (down 24%) at this time last year; New Listings in August were down 1% compared to July 2020, up 46% compared to August 2019 and up 15% compared to August 2018. Month’s Supply of Total Residential Listings is up to 3 Month’s Supply (Balanced Market with strong signs of Seller’s Market conditions) and a Sales to Listings Ratio of 61% compared to 70% in July 2020, 68% in August 2019 and 49% in August 2018. Year-over-year, the House Price Index is up 6.5%.
Ladner: Total Units Sold in August was 40 – down from 49 (18%) in July 2020, up from 33 (21%) in August 2019, down from 46 (13%) in August 2018; Active Listings are at 155 compared to 192 (down 19%) at this time last year; New Listings in August were down 4% compared to July 2020, up 3% compared to August 2019 and up 50% compared to August 2018. Month’s Supply of Total Residential Listings is up to 4 Month’s Supply (Balanced Market with strong signs of Seller’s Market conditions) and a Sales to Listings Ratio of 58% compared to 68% in July 2020, 49% in August 2019 and 50% in August 2018. Year-over-year, the House Price Index is up 6.9%.
Tsawwassen: Total Units Sold in August was 53 – down from 62 (2%) in July 2020, up from 73 (38%) in August 2019, up from 45 (59%) in August 2018; Active Listings are at 319 compared to 294 (down 5%) at this time last year; New Listings in August were down 13% compared to July 2020, up 52% compared to August 2019 and up 147% compared to August 2018. Month’s Supply of Total Residential Listings is up to 6 Month’s Supply (Balanced Market with strong signs of Seller’s Market conditions) and a Sales to Listings Ratio of 48% compared to 48% in July 2020, 41% in August 2019 and 56% in August 2018. Year-over-year, the House Price Index is up 5.1%.
Pitt Meadows: Total Units Sold in August was 42 – down from 48 (12%) in July 2020, up from 39 (38%) in August 2019, up from 23 (83%) in August 2018; Active Listings are at 90 compared to 118 (down 23%) at this time last year; New Listings in August were down 21% compared to July 2020, up 28% compared to August 2019 and up 4% compared to August 2018. Month’s Supply of Total Residential Listings is at 2 Month’s Supply (Balanced Market with strong signs of Seller’s Market conditions) and a Sales to Listings Ratio of 85% compared to 77% in July 2020, 102% in August 2019 and 48% in August 2018. Year-over-year, the House Price Index is up 3.1%.
Maple Ridge: Total Units Sold in August was 216 – down from 246 (12%) in July 2020, up from 133 (62%) in August 2019, up from 121 (79%) in August 2018; Active Listings are at 681 compared to 14,191 (down 18%) at this time last year; New Listings in August were down 17% compared to July 2020, up 43% compared to August 2019 and up 20% compared to August 2018. Month’s Supply of Total Residential Listings is at 3 Month’s Supply (Balanced Market with strong signs of Seller’s Market conditions) and a Sales to Listings Ratio of 71% compared to 67% in July 2020, 63% in August 2019 and 48% in August 2018. Year-over-year, the House Price Index is up 4.7%.