RSS

Attached are the Sales and Listings Stats updated to the end of March 2019. Ok, next! Let’s just move on to April! But for those looking for a recap, there were 1,743 sales in Greater Vancouver in March 2019, the lowest total for the month of March since 1986. So here is what we know; it was a slow month for home sales, buyers and sellers are both hesitant in the market, The Federal Government announced their budget in March and provided little in the way of benefits to buyers in our market area and now we see fixed interest rates coming down. Here’s what we don’t know; while fixed rates are falling, how far will they fall, will there be federal election promises to boost the housing market prior to October’s election, where will the inventory of resale homes go after moderately increasing in a slower market for sales. And what don’t we know: how many buyers and sellers are waiting eagerly on the sidelines to make a move – pent up demand is growing! And policy changes can only keep that demand down for so long.

The 1,743 homes sold in Greater Vancouver in March were up from 1,512 (15%) from February this year. This was compared with 2,551 sales (down 35%) in March last year and 3,632 sales in March 2017. This was 45 per cent below the 10-year average for March. In looking around Greater Vancouver, both Vancouver’s Westside and North Vancouver saw the most significant increases in sales month over month at 33 per cent and 35 per cent respectively. While West Vancouver, Port Coquitlam and Tsawwassen had sales in March lower than February. In Burnaby East there were zero detached house sales in March. Regional markets are different in their make up and activity, but we typically see Vancouver be a leading indicator in the market. So again, let’s move into April.

On the other side of the equation, there were 5,057 new listings in March in Greater Vancouver, up from 4,557 in March last year and up from 3,974 in February 2019. The number of new listings in March were 12 per cent below the 10-year average for March. There are currently 13,408 Active Listings on the market in Greater Vancouver – up from 9,037 at the end of March last year. While Active Listings are up 48 per cent, they are still relatively low compared to previous markets with similar activity. In 1998 there were 1,921 sales in March with 19,488 Active Listings and in 2013 there were 2,373 sales with 16,322 Active Listings. The lack of inventory is still keeping buyers at bay in some areas. In Vancouver’s Westside the amount of detached homes for sale decreased in March to 694 from 713 in February, an unusual trend for a spring market.

“Housing demand today isn’t aligning with our growing economy and low unemployment rates. The market trends we’re seeing are largely policy induced,” Ashley Smith, Real Estate Board of Greater Vancouver president said. “For three years, governments at all levels have imposed new taxes and borrowing requirements on the housing market. What policymakers are failing to recognize is that demand-side measures don’t eliminate demand, they sideline potential home buyers in the short term. That demand is ultimately satisfied down the line because shelter needs don’t go away. Using public policy to delay local demand in the housing market just feeds disruptive cycles that have been so well-documented in our region.”

The Fraser Valley Real Estate Board processed 1,221 sales of all property types on its MLS® in March, a 24.3 per cent increase compared to sales in February 2019, and a 26.6 per cent decrease compared to the 1,664 sales in March of last year. Of the 1,221 total sales, 462 were residential detached homes, 300 were townhouses, and 346 apartments. This was the lowest sales total for the Board for March since 2013. Darin Germyn, President of the Fraser Valley Real Estate Board, said “From a buyer’s perspective, there are more opportunities available as we move deeper into spring. Many of our communities are seeing higher inventory levels, especially in the attached market with the number of available townhomes almost doubling and Fraser Valley condos more than doubling compared to last year.”

Here’s a summary of the numbers:

Greater Vancouver: Total Units Sold in March 2019 was 1,745 – up from 1,512  (15%) in February 2019, down from 2,551 (32%) in March 2018, down from 3,632 (52%) in March 2017; Active Listings are at 13,408 compared to 9,037 at this time last year; New Listings in March 2019 were up 27% compared to February 2019; were up 10% compared to March 2018 and up 3% compared to March 2017; Month’s Supply of Total Residential Listings is steady at 8 Month’s Supply (Buyer’s Market) and a Sales to Listings Ratio of 35% compared to 38% in February 2019.

Vancouver Westside Residential: Total Units Sold in March 2019 was 333 – up from 254  (31%) in February 2019, down from 441 (24%) in March 2018, down from 616 (38%) in March 2017; Active Listings are at 2,511 compared to 1,691 at this time last year; New Listings in March 2019 were up 12% compared to February 2019; were up 11% compared to March 2018 and up 20% compared to March 2017; Month’s Supply of Total Residential Listings is down to 8 Month’s Supply (Buyer’s Market) and a Sales to Listings Ratio of 34% compared to 29% in February 2019.

Vancouver Eastside Residential: Total Units Sold in March 2019 was 174 – up from 166  (5%) in February 2019, down from 284 (39%) in March 2018, down from 384 (55%) in March 2017; Active Listings are at 1,239 compared to 1,043 at this time last year; New Listings in March 2019 were up 32% compared to February 2019; were the same compared to March 2018 and down 3% compared to March 2017; Month’s Supply of Total Residential Listings is steady at 7 Month’s Supply (Buyer’s Market) and a Sales to Listings Ratio of 34% compared to 43% in February 2019.

North Vancouver Residential: Total Units Sold in March 2019 was 165 – up from 124  (33%) in February 2019, down from 216 (24%) in March 2018, down from 261 (37%) in March 2017; Active Listings are at 883 compared to 516 at this time last year; New Listings in March 2019 were up 16% compared to February 2019; were up 8% compared to March 2018 and up 14% compared to March 2017; Month’s Supply of Total Residential Listings is down to 5 Month’s Supply (Balanced Market) and a Sales to Listings Ratio of 42% compared to 37% in February 2019.

West Vancouver Houses: Total Units Sold in March 2019 was 34 – up from 39  (13%) in February 2019, down from 42 (19%) in March 2018, down from 97 (65%) in March 2017; Active Listings are at 670 compared to 585 at this time last year; New Listings in March 2019 were down 1% compared to February 2019; were up 9% compared to March 2018 and down 20% compared to March 2017; Month’s Supply of Total Residential Listings is up to 20 Month’s Supply (Buyer’s Market) and a Sales to Listings Ratio of 20% compared to 23% in February 2019.

Richmond Residential: Total Units Sold in March 2019 was 178 – up from 155  (15%) in February 2019, down from 306 (42%) in March 2018, down from 537 (67%) in March 2017; Active Listings are at 2,025 compared to 1,379 at this time last year; New Listings in March 2019 were up 42% compared to February 2019; were up 10% compared to March 2018 and down 1% compared to March 2017; Month’s Supply of Total Residential Listings is down to 11 Month’s Supply (Buyer’s Market) and a Sales to Listings Ratio of 26% compared to 33% in February 2019.

Burnaby East: Total Units Sold in March 2019 was 17 – the same as in February 2019, down from 26 (35%) in March 2018, down from 53 (68%) in March 2017; Active Listings are at 141 compared to 123 at this time last year; New Listings in March 2019 were up 42% compared to February 2019; were up 24% compared to March 2018 and down 20% compared to March 2017; Month’s Supply of Total Residential Listings is up to 8 Month’s Supply (Buyer’s Market) and a Sales to Listings Ratio of 33% compared to 47% in February 2019.

Burnaby North: Total Units Sold in March 2019 was 77 – down from 84 (8%) in February 2019, down from 131 (41%) in March 2018, down from 170 (55%) in March 2017; Active Listings are at 536 compared to 314 at this time last year; New Listings in March 2019 were up 40% compared to February 2019; were up 4% compared to March 2018 and down 6% compared to March 2017; Month’s Supply of Total Residential Listings is up to 7 Month’s Supply (Buyer’s Market) and a Sales to Listings Ratio of 34% compared to 53% in February 2019.

Burnaby South: Total Units Sold in March 2019 was 97 – up from 83  (17%) in February 2019, down from 103 (6%) in March 2018, down from 167 (42%) in March 2017; Active Listings are at 771 compared to 390 at this time last year; New Listings in March 2019 were up 40% compared to February 2019; were up 48% compared to March 2018 and up 29% compared to March 2017; Month’s Supply of Total Residential Listings is steady at 8 Month’s Supply (Buyer’s Market) and a Sales to Listings Ratio of 33% compared to 40% in February 2019.

New Westminster: Total Units Sold in March 2019 was 81 – up from 63 (29%) in February 2019, down from 149 (46%) in March 2018, down from 166 (51%) in March 2017; Active Listings are at 472 compared to 224 at this time last year; New Listings in March 2019 were up 24% compared to February 2019; were up 5% compared to March 2018 and down 1% compared to March 2017; Month’s Supply of Total Residential Listings is down to 6 Month’s Supply (Buyer’s Market) and a Sales to Listings Ratio of 40% compared to 38% in February 2019.

Coquitlam: Total Units Sold in March 2019 was 142 – up from 134 (6%) in February 2019, down from 204 (30%) in March 2018, down from 303 (53%) in March 2017; Active Listings are at 933 compared to 552 at this time last year; New Listings in March 2019 were up 42% compared to February 2019; were up 27% compared to March 2018 and up 9% compared to March 2017; Month’s Supply of Total Residential Listings is up to 7 Month’s Supply (Buyer’s Market) and a Sales to Listings Ratio of 35% compared to 46% in February 2019.

Port Moody: Total Units Sold in March 2019 was 38 – up from 30 (27%) in February 2019, down from 57 (33%) in March 2018, down from 83 (54%) in March 2017; Active Listings are at 210 compared to 131 at this time last year; New Listings in March 2019 were up 19% compared to February 2019; were up 22% compared to March 2018 and the same compared to March 2017; Month’s Supply of Total Residential Listings is steady at 6 Month’s Supply (Balanced Market) and a Sales to Listings Ratio of 40% compared to 38% in February 2019.

Port Coquitlam: Total Units Sold in March 2019 was 59 – down from 60 (1%) in February 2019, down from 103 (43%) in March 2018, down from 139 (58%) in March 2017; Active Listings are at 343 compared to 160 at this time last year; New Listings in March 2019 were up 19% compared to February 2019; were up 34% compared to March 2018 and down 6% compared to March 2017; Month’s Supply of Total Residential Listings is up to 6 Month’s Supply (Balanced Market) and a Sales to Listings Ratio of 35% compared to 43% in February 2019.

Ladner: Total Units Sold in March 2019 was 25 – up from 20 (25%) in February 2019, up from 24 (3%) in March 2018, down from 45 (44%) in March 2017; Active Listings are at 170 compared to 126 at this time last year; New Listings in March 2019 were up 54% compared to February 2019; were up 40% compared to March 2018 and up 4% compared to March 2017; Month’s Supply of Total Residential Listings is steady at 7 Month’s Supply (Buyer’s Market) and a Sales to Listings Ratio of 32% compared to 40% in February 2019.

Tsawwassen: Total Units Sold in March 2019 was 15 – down from 21 (29%) in February 2019, down from 39 (62%) in March 2018, down from 58 (74%) in March 2017; Active Listings are at 236 compared to 194 at this time last year; New Listings in March 2019 were up 55% compared to February 2019; were up 2% compared to March 2018 and up 16% compared to March 2017; Month’s Supply of Total Residential Listings is up to 16 Month’s Supply (Buyer’s Market) and a Sales to Listings Ratio of 18% compared to 38% in February 2019.

Pitt Meadows: Total Units Sold in March 2019 was 24 – the same as February 2019, down from 34 (29%) in March 2018, down from 44 (45%) in March 2017; Active Listings are at 119 compared to 52 at this time last year; New Listings in March 2019 were up 34% compared to February 2019; were up 61% compared to March 2018 and down 17% compared to March 2017; Month’s Supply of Total Residential Listings is down to 5 Month’s Supply (Balanced Market) and a Sales to Listings Ratio of 43% compared to 36% in February 2019.

Maple Ridge: Total Units Sold in March 2019 was 116 – up from 100 (16%) in February 2019, down from 180 (35%) in March 2018, down from 262 (56%) in March 2017; Active Listings are at 675 compared to 422 at this time last year; New Listings in March 2019 were up 26% compared to February 2019; down 8% compared to March 2018 and down 17% compared to March 2017; Month’s Supply of Total Residential Listings is up to 6 Month’s Supply (Balanced Market) and a Sales to Listings Ratio of 44% compared to 48% in February 2019.

Kevin Skipworth

Dexter Realty

Broker/Owner

Read

Sales and listings stats are attached as of February 15, 2019. While the weather turned colder in February, the real estate market warmed up. Sales have increased at mid month compared to the same period in January. With 782 homes sold for the first half of February compared to 396 at the same time in January 2019, buyers were coming back to the market. Even with a week of snow, the number were higher. There were 2,240 new listings at this time compared to 1,940 new listings up to January 14 2019 showing that buyers are much more active than sellers. In fact, Richmond and Burnaby saw fewer new listings at mid month in February compared to January. And East Vancouver townhouses and condos have seen as many sales’ mid month in February as there were in all of January. Here is a summary of the activity so far in February 2019:

Greater Vancouver: 782 Units Sold so far in February 2019 compared to 396 Units Sold so far at this time in January 2019. Total New Listings so far in January are 2,240 compared to 1,940 at this point in January 2019. Total Active Listings are at 11,910 compared to 10,183 at mid month in January 2019. Sales To Listings Ratio is at 35% compared to 19% in January 2019 at mid month.

Vancouver West: 131 Units Sold so far in February 2019 compared to 57 Units Sold so far at this time in January 2019. Total New Listings so far in January are 514 compared to 367 at this point in January 2019. Total Active Listings are at 2,240 compared to 1,175 at mid month in January 2019. Sales To Listings Ratio is at 25% compared to 16% in January 2019 at mid month.

Vancouver East: 87 Units Sold so far in February 2019 compared to 41 Units Sold so far at this time in January 2019. Total New Listings so far in January are 216 compared to 193 at this point in January 2019. Total Active Listings are at 1,099 compared to 968 at mid month in January 2019. Sales To Listings Ratio is at 40% compared to 21% in January 2019 at mid month.

North Vancouver: 63 Units Sold so far in February 2019 compared to 31 Units Sold so far at this time in January 2019. Total New Listings so far in January are 194 compared to 151 at this point in January 2019. Total Active Listings are at 782 compared to 604 at mid month in January 2019. Sales To Listings Ratio is at 32% compared to 21% in January 2019 at mid month.

West Vancouver: 17 Units Sold so far in February 2019 compared to 7 Units Sold so far at this time in January 2019. Total New Listings so far in January are 107 compared to 91 at this point in January 2019. Total Active Listings are at 629 compared to 544 at mid month in January 2019. Sales To Listings Ratio is at 16% compared to 8% in January 2019 at mid month.

Richmond: 75 Units Sold so far in February 2019 compared to 49 Units Sold so far at this time in January 2019. Total New Listings so far in January are 273 compared to 293 at this point in January 2019. Total Active Listings are at 1,805 compared to 1,460 at mid month in January 2019. Sales To Listings Ratio is at 27% compared to 17% in January 2019 at mid month.

Burnaby East: 7 Units Sold so far in February 2019 compared to 3 Units Sold so far at this time in January 2019. Total New Listings so far in January are 19 compared to 22 at this point in January 2019. Total Active Listings are at 122 compared to 106 at mid month in January 2019. Sales To Listings Ratio is at 37% compared to 14% in January 2019 at mid month.

Burnaby North: 46 Units Sold so far in February 2019 compared to 22 Units Sold so far at this time in January 2019. Total New Listings so far in January are 78 compared to 91 at this point in January 2019. Total Active Listings are at 471 compared to 441 at mid month in January 2019. Sales To Listings Ratio is at 59% compared to 22% in January 2019 at mid month.

Burnaby South: 47 Units Sold so far in February 2019 compared to 23 Units Sold so far at this time in January 2019. Total New Listings so far in January are 118 compared to 105 this point in January 2019. Total Active Listings are at 662 compared to 570 at mid month in January 2019. Sales To Listings Ratio is at 40% compared to 22% in January 2019 at mid month.

New Westminster: 34 Units Sold so far in February 2019 compared to 27 Units Sold so far at this time in January 2019. Total New Listings so far in January are 85 compared to 75 at this point in January 2019. Total Active Listings are at 403 compared to 364 at mid month in January 2019. Sales To Listings Ratio is at 40% compared to 36% in January 2019 at mid month.

Coquitlam: 75 Units Sold so far in February 2019 compared to 17 Units Sold so far at this time in January 2019. Total New Listings so far in January are 154 compared to 144 at this point in January 2019. Total Active Listings are at 806 compared to 726 at mid month in January 2019. Sales To Listings Ratio is at 49% compared to 12% in January 2019 at mid month.

Port Moody: 17 Units Sold so far in February 2019 compared to 10 Units Sold so far at this time in January 2019. Total New Listings so far in January are 43 compared to 25 at this point in January 2019. Total Active Listings are at 172 compared to 145 at mid month in January 2019. Sales To Listings Ratio is at 40% compared to 40% in January 2019 at mid month.

Port Coquitlam: 25 Units Sold so far in February 2019 compared to 16 Units Sold so far at this time in January 2019. Total New Listings so far in January are 73 compared to 67 at this point in January 2019. Total Active Listings are at 303 compared to 251 at mid month in January 2019. Sales To Listings Ratio is at 34% compared to 24% in January 2019 at mid month.

Ladner: 13 Units Sold so far in February 2019 compared to 1 Units Sold so far at this time in January 2019. Total New Listings so far in January are 29 compared to 24 at this point in January 2019. Total Active Listings are at 140 compared to 132 at mid month in January 2019. Sales To Listings Ratio is at 45% compared to 4% in January 2019 at mid month.

Tsawwassen: 11 Units Sold so far in February 2019 compared to 2 Units Sold so far at this time in January 2019. Total New Listings so far in January are 31 compared to 37 at this point in January 2019. Total Active Listings are at 190 compared to 175 at mid month in January 2019. Sales To Listings Ratio is at 35% compared to 5% in January 2019 at mid month.

Kevin Skipworth

Dexter Realty

Broker/Owner


2 Attachments          


Read

Sales and Listings Report for January 2019

 “Look at everything as though you were seeing it either for the first or last time.” – Betty Smith

Attached are the Sales and Listings Report updated to the end of January 2019. New Year, a similar mentality to start the year with a wait and see attitude in the market with both buyers and sellers. But the feeling is one of some growth of opportunity in the market with prices coming off lofty highs and some multiple offers occurring. Call it tempered optimism. There were 1,120 home sales in Greater Vancouver in January this year, the third lowest total since 2000 (771 in 2009 and 1,062 in 2000). With only 1,094 home sales in December it is curious that only twice since 2000 have sales in January been higher than the preceding December as January is typically a slow month to start the year. Sales in January were 35 per cent below the 10-year average for January, not surprising after the year we had in 2018. With 4,980 new listings in January this year, it was 27 per cent up from January 2018 and only up 3 per cent from the 10 year average. Total sales for Greater Vancouver in January were 1,864 – up 6.5 per cent from January 2017 and up 6.4 per cent on the ten year average. Total active listings were at 11,427 at month’s end, compared to 7,371 in January 2018, 7,834 in January 2017 and 11,753 in January 2015.

With the real estate market in Metro Vancouver firmly entrenched in a Buyer’s Market, what brought us here. The detached market has existed with these conditions much of the last two years. It was the multifamily market that shifted towards these conditions in 2018 and are very much that way to start 2019. Apartment listings are 2 to 3 times higher than they were in 2018 to start while the number of detached homes on the market is just slightly above where they were in January 2018, and in East Vancouver there were less detached homes on the market at the end of January 2019 compared to January 2018. With the total number of occupied households up 27 per cent since 2001, there are far few homes listed in comparison to the total number of homes available to be sold. Where 2019 will go from here will in part depend on the pace of listings that come on the market. As it stands now, there is a lack of real inventory on the market. Some of what is currently listed on the market are listings that are priced beyond current market values and some are listed as part of land assemblies. There is demand waiting to buy, but looking for the right property and the right price. With word of one detached house listing on Vancouver’s East Side this weekend having 49 offers on it (there were only 44 detached sales in all of January), it would appear buyers are there.

“REALTORS® are seeing more traffic at open houses compared to recent months, however buyers are choosing to remain in a holding pattern for the time being,” Phil Moore, Real Estate Board of Greater Vancouver president said. “Home prices have edged down across all home types in the region over the last seven months.”

In the Fraser Valley, there were 784 sales of all property types which was a 35.2 per cent decrease compared to January of last year and a 2 per cent decrease from December 2018. Of the 784 sales last month, 250 were residential detached homes, 190 were townhouses and 257 were apartments. This is the first time in the Board’s history that apartments have outsold residential detached homes during a month.

“This remains a challenging environment for buyers and sellers alike,” said John Barbisan, President of the Fraser Valley Real Estate Board. “Factors such as reduced buying power, changing expectations for pricing, and a recovering inventory are all having an impact.”

Here’s a summary of the numbers:

Greater Vancouver: Total Units Sold in January 2019 was 1,120 – down from 1,846 (39%) from January 2018, down from 1,553 (28%) in January 2017; Active Listings are at 11,427 compared to 7,371 at this time last year; New Listings in January 2018 were up 27% compared to January 2018; Month’s Supply of Total Residential Listings is at 10 Month’s Supply (Buyer’s Market) and a Sales to Listings Ratio of 22% compared to 47% in January 2018.

Vancouver Westside Residential: Total Units Sold in January 2019 was 187 – down from 313 (40%) from January 2018, down from 271 (31%) in January 2017; Active Listings are at 2,084 compared to 1,331 at this time last year; New Listings in January 2018 were up 21% compared to January 2018; Month’s Supply of Total Residential Listings is at 11 Month’s Supply (Buyer’s Market) and a Sales to Listings Ratio of 19% compared to 39% in January 2018.

Vancouver Eastside Residential: Total Units Sold in January 2019 was 105 – down from 137 (23%) from January 2018, down from 139 (24%) in January 2017; Active Listings are at 1,071 compared to 922 at this time last year; New Listings in January 2018 were up 16% compared to January 2018; Month’s Supply of Total Residential Listings is at 10 Month’s Supply (Buyer’s Market) and a Sales to Listings Ratio of 23% compared to 34% in January 2018.

North Vancouver Residential: Total Units Sold in January 2019 was 91 – down from 132 (31%) from January 2018, down from 107 (15%) in January 2017; Active Listings are at 740 compared to 413 at this time last year; New Listings in January 2018 were up 47% compared to January 2018; Month’s Supply of Total Residential Listings is at 8 Month’s Supply (Buyer’s Market) and a Sales to Listings Ratio of 21% compared to 45% in January 2018.

West Vancouver Houses: Total Units Sold in January 2019 was 26 – down from 43 (40%) from January 2018, the same as January 2017; Active Listings are at 599 compared to 493 at this time last year; New Listings in January 2018 were up 21% compared to January 2018; Month’s Supply of Total Residential Listings is at 23 Month’s Supply (Buyer’s Market) and a Sales to Listings Ratio of 11% compared to 23% in January 2018.

Richmond Residential: Total Units Sold in January 2019 was 121 – down from 275 (56%) from January 2018, down from 225 (46%) in January 2017; Active Listings are at 1,696 compared to 1,104 at this time last year; New Listings in January 2018 were up 39% compared to January 2018; Month’s Supply of Total Residential Listings is at 14 Month’s Supply (Buyer’s Market) and a Sales to Listings Ratio of 16% compared to 50% in January 2018.

Burnaby East: Total Units Sold in January 2019 was 11 – down from 29 (62%) from January 2018, down from 18 (39%) in January 2017; Active Listings are at 119 compared to 114 at this time last year; New Listings in January 2018 were down 14% compared to January 2018; Month’s Supply of Total Residential Listings is at 11 Month’s Supply (Buyer’s Market) and a Sales to Listings Ratio of 20% compared to 45% in January 2018.

Burnaby North: Total Units Sold in January 2019 was 65 – down from 73 (11%) from January 2018, down from 72 (10%) in January 2017; Active Listings are at 483 compared to 264 at this time last year; New Listings in January 2018 were up 34% compared to January 2018; Month’s Supply of Total Residential Listings is at 7 Month’s Supply (Buyer’s Market) and a Sales to Listings Ratio of 30% compared to 45% in January 2018.

Burnaby South: Total Units Sold in January 2019 was 55 – down from 102 (46%) from January 2018, down from 86 (36%) in January 2017; Active Listings are at 657 compared to 361 at this time last year; New Listings in January 2018 were up 38% compared to January 2018; Month’s Supply of Total Residential Listings is at 12 Month’s Supply (Buyer’s Market) and a Sales to Listings Ratio of 20% compared to 50% in January 2018.

New Westminster: Total Units Sold in January 2019 was 75 – down from 96 (22%) from January 2018, up from 63 (19%) in January 2017; Active Listings are at 386 compared to 205 at this time last year; New Listings in January 2018 were up 26% compared to January 2018; Month’s Supply of Total Residential Listings is at 5 Month’s Supply (Balanced Market) and a Sales to Listings Ratio of 38% compared to 62% in January 2018.

Coquitlam: Total Units Sold in January 2019 was 87 – down from 156 (44%) from January 2018, down from 114 (24%) in January 2017; Active Listings are at 788 compared to 469 at this time last year; New Listings in January 2018 were up 39% compared to January 2018; Month’s Supply of Total Residential Listings is at 9 Month’s Supply (Buyer’s Market) and a Sales to Listings Ratio of 23% compared to 58% in January 2018

Port Moody: Total Units Sold in January 2019 was 31 – down from 46 (33%) from January 2018, down from 43 (28%) in January 2017; Active Listings are at 165 compared to 100 at this time last year; New Listings in January 2018 were up 22% compared to January 2018; Month’s Supply of Total Residential Listings is at 5 Month’s Supply (Detached is a Buyer’s Market, Townhomes and Apartments a Balanced Market) and a Sales to Listings Ratio of 37% compared to 68% in January 2018.

Port Coquitlam: Total Units Sold in January 2019 was 38 – down from 58 (34%) from January 2018, down from 60 (37%) in January 2017; Active Listings are at 290 compared to 155 at this time last year; New Listings in January 2018 were up 35% compared to January 2018; Month’s Supply of Total Residential Listings is at 8 Month’s Supply (Buyer’s Market) and a Sales to Listings Ratio of 27% compared to 55% in January 2018.

Pitt Meadows: Total Units Sold in January 2019 was 10 – down from 18 (44%) from January 2018, down from 23 (57%) in January 2017; Active Listings are at 96 compared to 57 at this time last year; New Listings in January 2018 were up 25% compared to January 2018; Month’s Supply of Total Residential Listings is at 10 Month’s Supply (Buyer’s Market) and a Sales to Listings Ratio of 25% compared to 58% in January 2018.

Maple Ridge: Total Units Sold in January 2019 was 82 – down from 182 (54%) from January 2018, down from 100 (28%) in January 2017; Active Listings are at 602 compared to 343 at this time last year; New Listings in January 2018 were up 16% compared to January 2018; Month’s Supply of Total Residential Listings is at 7 Month’s Supply (Buyer’s Market) and a Sales to Listings Ratio of 32% compared to 84% in January 2018.

Ladner: Total Units Sold in January 2019 was 16 – down from 19 (16%) from January 2018, down from 18 (11%) in January 2017; Active Listings are at 143 compared to 102 at this time last year; New Listings in January 2018 were up 15% compared to January 2018; Month’s Supply of Total Residential Listings is at 9 Month’s Supply (Buyer’s Market) and a Sales to Listings Ratio of 26% compared to 35% in January 2018.

Tsawwassen: Total Units Sold in January 2019 was 14 – down from 16 (12%) from January 2018, down from 21 (33%) in January 2017; Active Listings are at 182 compared to 157 at this time last year; New Listings in January 2018 were up 18% compared to January 2018; Month’s Supply of Total Residential Listings is at 13 Month’s Supply (Buyer’s Market) and a Sales to Listings Ratio of 19% compared to 26% in January 2018.


Kevin Skipworth

Dexter Realty

Broker/Owner

Read

FIRST TIME HOME BUYERS

VANCOUVER & beyond . . .


No App can replace a REALTOR®


Connie McGinley - Dexter Realty


Join us at our New Dexter offices in South Granville for Complimentary Drinks, Appetizers, Door Prizes and Everything you need to know about getting in the Real Estate Market.


Venue: #560-2608 Granville Street, Vancouver BC

(Granville at 10th Avenue above Pottery Barn)

Date: Tuesday, February 26th, 2019

Time: 6:30 – 7:30pm


Like us on Facebook - First Time Home Buyer Vancouver

Follow us on Instagram and Twitter @FTHBvan #FTHBvan


RSVP: To attend this free event please contact

mcginley@dexterrealty.com

Space is limited – Reserve today


Connie McGinley – REALTOR ®

604-916-9656  @conmcginley


Read

BC Speculation and Vacancy Tax and City of Vancouver Empty Homes Tax

Below are the breakdowns of both the B.C. Speculation and Vacancy Tax and the City of Vancouver Empty Homes Tax. The key is to be aware of the timelines for declaration. Both require every property owner to make a declaration and the B.C. Speculation and Vacancy Tax requires all owners of the property to make a separate declaration. If they don’t, the tax will be applied to their share of title.

Speculation Tax – https://www2.gov.bc.ca/gov/content/taxes/property-taxes/speculation-and-vacancy-tax 

  • The tax applies to residential properties in Capital Regional District (Victoria), Metro Vancouver Regional District excluding Bowen Island, Village of Lions Bay but including the University Endowment Lands and UBC, City of Abbotsford, District of Mission, City of Chilliwack, City of Kelowna and West Kelowna, City of Nanaimo and District of Lantzville

  • The tax will 0.5% for 2018 and 0.5 for Residents of British Columbia and Canadian Citizens and 2% for Foreign Nationals in 2019 and going forward from there.

  • All residential property owners on title in designated taxable regions of B.C will have to complete an annual declaration for the Speculation and Vacancy Tax to claim any relevant exemptions. Where there are multiple owners of a home, a declaration must be completed by each owner.

  • Declaration will be sent in mid-February and will be due by March 31st each year and any tax owing will be due July 2 of each year

  • Anyone who uses their home as their principal residence is exempt. For this exemption, an owner must be a Canadian citizen or permanent resident of Canada who’s a B.C. resident for income tax purposes and isn’t part of a satellite family

  • Long-term rentals are exempt from the tax.

  • 2018 – Homes must be rented out for at least 3 months.

  • 2019 - Homes must be rented out for at least 6 months, in increments of 30 days or more.

  • Strata buildings with rental restrictions are exempt for 2018 and 2019 only as long as the rental bylaw was in place as of October 2018.

  • Special Case Exemptions:

    • Owner/tenant undergoing medical care, in hospital, long-term care facility

    • Owner/tenant – temporarily absent for work purposes

    • Registered owner is deceased, estate is being processed

    • Exemptions are listed here: https://www2.gov.bc.ca/gov/content/taxes/property-taxes/speculation-and-vacancy-tax/exemptions-speculation-and-vacancy-tax/individuals

Empty Home Tax (City of Vancouver Only) - https://vancouver.ca/home-property-development/empty-homes-tax.aspx

  • The City of Vancouver Empty Home Tax “EHT” became effective January 1, 2017. The Empty Home Tax is applied annually with the first taxation year beginning January 1, 2017. The tax for 2017 was payable by April 2018. The tax rate is 1% of the assessed value based on the assessment in the year the tax is paid. For 2019 the tax if applicable will be due by April 12, 2019.

  • The EHT does not apply to a home used as a principal residence or is subject to a long term tenancy agreement of at least 180 days accrued in a calendar year with a minimum of 30 day terms for the tenancies.

  • There are various exemptions for the EHT for situations such as major renovations, major illness, death of the owner, ownership of the property changed curing the previous year, strata rental restrictions that were in place prior to November 16, 2016, homes used for work orders, homes subject to a court order. Explanations for these can be found on the City of Vancouver website https://vancouver.ca/home-property-development/will-your-home-be-taxed.aspx

Every residential home owner in the City of Vancouver must submit an Empty Home Declaration by February 4th each year, whether the property is deemed vacant or not. Failure to do so will result in the City declaring the property vacant.


Kevin Skipworth

Dexter Realty

Broker/Owner

Read

Sales and Listings Report for Greater Vancouver - December 2018

Happy New Year! All the best for a successful 2019 ahead!

As we reflect on 2018, it was certainly the year of intervention into the real estate market. What we thought was intervention in the previous two years, became a race this year to add as many variables as possible to “create affordability.”  Attached are the yearend 2018 Sales and Listings Stats in Greater Vancouver. There were 24,961 home sales in Greater Vancouver in 2018, the lowest annual amount of sales since the year 2000 at 21,940. There were 55,057 new listings in 2018 in Greater Vancouver, the lowest annual amount since 2009. Clearly the real estate market was in a wait and see mode last year. While we saw the detached home market continue to struggle – a trend that extended out to the suburbs, it was the townhome and apartment market that after a quick start, slowed down as the year progressed. Of the total sales in Greater Vancouver, 49 per cent were apartments which was down from 49 per cent in 2017 (up from 46 per cent in 2016 and 42 per cent in 2015), 17 per cent were townhouses similar to 2017 (up from 15 per cent in 2016 and the same at 17 per cent in 2015) and 32 percent were houses which was the same as 2017 (down from 36 per cent in 2016 and 41 per cent in 2015). While the detached housing market had already slowed down in 2017 and continued at these slower sales levels in 2018, the bulk of the drop in overall sales in Greater Vancouver in 2018 came from the townhouse and apartment market. Vancouver’s Westside continues to see 73 per cent of sales being apartments which accounted for a bigger drop overall in the Westside market. Month’s Supply of Inventory has moved up over the last year, finishing with most areas above 6 months, putting them in Buyer’s Market conditions. North Vancouver, Port Moody, Coquitlam and Port Coquitlam averaged 4 to 6 Months Supply of Townhouses and Apartments, fairing better than other areas. Affordability seemed to be the key to driving demand down as the year went on, not surprising given the new Federal Government Stress Test regulations put in place for lending to start 2018. More on that later.

In the Fraser Valley there were 15,586 sales in 2018, which was down 30.2 per cent from the record of 23,974 sales in 2016 and 22,338 sales in 2017. It was the lowest total sales in the Fraser Valley since 2013. Of the total sales, 3,866 were townhouses and 4,296 were apartments. Each of those property types saw a significant decrease in sales compared to 2017. Total townhouse sales dropped 25.6 per cent year over year and total apartments sales dropped 30.5 per cent year over year. In terms of inventory, there were a total of 32,058 new listings processed in the Fraser Valley in 2018. That was the fourth highest total for new inventory in the Board’s history.

Some highlights in market areas during 2017:

  • Total sales of Detached Houses in West Vancouver declined from 1074 in 2015 to 834 in 2016 to 509 sales in 2017 and 328 sales in 2018

  • Total sales of Detached Houses on Vancouver’s West Side declined from 2,031 in 2015, to 1,591 in 2016 to 1,058 in 2017 and 705 in 2018

  • Total sales for Greater Vancouver All Residential declined from 43,155 in 2015, to 40,880 in 2016, to 36,604 in 2017 and 25,051 in 2018. You could almost say the government was late to the party by intervening in 2018.

Just when we thought that government policy was heavy in the real estate market in 2016 and 2017, along came 2018. The year started with the implementation of the B 20 Mortgage Stress Test which now requires any mortgage with a down payment of 20 per cent or more to have the buyer qualify at the contract interest rate plus 2 per cent or the Bank of Canada Posted Rate (currently at 5.34 per cent). This was in place for insured mortgages with a down payment less than 20 per cent already. The effect was to essentially reduce the purchasing power of buyers by 20 per cent. That change had the single biggest impact on the real estate market in 2018, not just in Vancouver but across the country – more so the lower end of the market. Then in February the British Columbia government lead by the NDP introduced a host of measures in their budget aimed at controlling demand. Namely the Speculation and Vacancy Tax (SVT), an increase in School Taxes and the Property Transfer Tax for properties assessed at $3 Million and above and an increase in the Foreign Buyer Tax to 20%. Both the SVT and Foreign Buyer Tax applied to areas in Metro Vancouver, Kelowna, Greater Victoria, Kelowna, Nanaimo and the Fraser Valley – affecting the higher end of the market and vacation properties to a greater extent. Between the Federal and Provincial government, all areas of the real estate market were smothered by policy which decreased demand and more so created psychological uncertainty. Any time new policies are introduced, there is an adjust period as buyers and sellers try to out think the market. And guess what, sales and listings were at their lowest point in years.

What will the real estate market bring in 2019 in Metro Vancouver? Well, what we are seeing here is not much different that other cities not only in Canada but around the world. Both in terms of housing issues but also market conditions. Here’s an example of headlines from articles of late: “San Francisco adds 6,500 residents, 2,200 homes in 2018 – Department of finance says populations still growing despite housing crisis”; “Why are Seattle-area home prices falling now?”; “London Housing Market Suffers Sharp Price Falls”; “New York Has Moved Into a Buyer’s Market, and Is Experiencing A Housing Trend Last Seen in 2009.” Global capital is pulling back, properties are staying on the market longer, and global concerns make for nervous buyers – Trump, Brexit, resistance against foreign capital invading property markets in many global cities, and concern over capital restrictions in China. That’s just a quick summary, and there are many micro economic and political conditions that affect local markets. And of course, markets shift as a normal course, as prices climb too high, demand pulls back. Our real estate market is no different. Of course, there will be many predictions on where our real estate market will go – and as usual predictions of sharp and significant declines will come. With population growing at such high rates, the economy being strong, livability in the City of Vancouver, Metro Vancouver and the province, there are many factors that fly in the face of panic selling or an exodus from our location to bring about significant price declines. Changing markets with a dose of intervention, how could we expect the market to act any differently than it did in 2018.

While active listings at the start of January 2019 were 9,413 (6,733 in 2018, 6,221 in 2017, and 6,312 in 2016), they were actually higher at the start of each year prior to 2016 going back to 2009. And it can be argued that up to 20 per cent of the current listings on market form part of a land assembly and can’t really be counted. What will determine pricing going forward will in large part be based on how many listings come on market. The lack of inventory still being experienced is keeping the market relatively stuck and prices from decreasing any more than they have – and listings aren’t likely to increase dramatically to help ease affordability. After all, while talk of supply solutions from the government were discussed, we’ve yet to see the action. “When you’re thirsty, it’s too late to think about digging a well.” – Anonymous.  

Here is a summary of the numbers:

Greater Vancouver: Total Units Sold in December 2018 was 1,094 – down from 1,633 in November 2018; down from 2,069 in December 2017 and down from 1,743 in December 2016. Total Active Listings were at 10,907 at month end, up from 7,540 at the end of December 2017, Month’s Supply of Total Residential Listings is at 10 Months (Buyer’s Market) compared to 4 Months Supply at the end of 2017 and Sales to Listings Ratio was 75% in December 2018 compared to 106% in December 2017. Benchmark Price is down 2.7% (Detached homes down 7.8% and Apartments up 0.6%).

Vancouver Westside: Total Units Sold in December 2018 was 190 – down from 298 in November 2018; down from 315 in December 2017 and down from 324 in December 2016. Total Active Listings were at 1,947 at month end, up from 1,284 at the end of December 2017, Month’s Supply of Total Residential Listings is at 10 Months (Buyer’s Market) compared to 4 Months Supply at the end of 2017 and Sales to Listings Ratio was 73% in December 2018 compared to 97% in December 2017. Benchmark Price is down 5.8% (Detached homes down 11.8% and Apartments down 2.9%).

Vancouver Eastside: Total Units Sold in December 2018 was 113 – down from 181 in November 2018; down from 239 in December 2017 and down from 183 in December 2016. Total Active Listings were at 1,075 at month end, up from 927 at the end of December 2017, Month’s Supply of Total Residential Listings is at 10 Months (Buyer’s Market) compared to 4 Months Supply at the end of 2017 and Sales to Listings Ratio was 85% in December 2018 compared to 115% in December 2017. Benchmark Price is down 4.6% (Detached homes down 7.2% and Apartments down 1.4%).

North Vancouver: Total Units Sold in December 2018 was 99 – down from 139 in November 2018; down from 138 in December 2017 and down from 138 in December 2016. Total Active Listings were at 630 at month end, up from 393 at the end of December 2017, Month’s Supply of Total Residential Listings is at 6 Months (Buyer’s Market) compared to 2 Months Supply at the end of 2017 and Sales to Listings Ratio was 125% in December 2018 compared to 197% in December 2017. Benchmark Price is down 3.7% (Detached homes down 8.2% and Apartments down 0.3%).

West Vancouver: Total Units Sold in December 2018 was 30 – the same amount in November 2018; down from 44 in December 2017 and down from 44 in December 2016. Total Active Listings were at 579 at month end, up from 356 at the end of December 2017, Month’s Supply of Total Residential Listings is at 19 Months (Buyer’s Market) compared to 8 Months Supply at the end of 2017 and Sales to Listings Ratio was 47% in December 2018 compared to 80% in December 2017. Benchmark Price is down 12.2% (Detached homes down 13.5% and Apartments down 2.6%).

Richmond: Total Units Sold in December 2018 was 122 – down from 178 in November 2018; down from 287 in December 2017 and down from 235 in December 2016. Total Active Listings were at 1,597 at month end, up from 1,184 at the end of December 2017, Month’s Supply of Total Residential Listings is at 13 Months (Buyer’s Market) compared to 4 Months Supply at the end of 2017 and Sales to Listings Ratio was 61% in December 2018 compared to 95% in December 2017. Benchmark Price is down 2.8% (Detached homes down 9.2% and Apartments up 2.5%).

Burnaby East: Total Units Sold in December 2018 was 17 – the same as November 2018; down from 28 in December 2017 and down from 20 in December 2016. Total Active Listings were at 115 at month end, up from 106 at the end of December 2017, Month’s Supply of Total Residential Listings is at 7 Months (Buyer’s Market) compared to 4 Months Supply at the end of 2017 and Sales to Listings Ratio was 85% in December 2018 compared to 112% in December 2017. Benchmark Price is down 2.1% (Detached homes down 10.6% and Apartments up 1.9%).

Burnaby North: Total Units Sold in December 2018 was 50 – down from 71 in November 2018; down from 99 in December 2017 and down from 85 in December 2016. Total Active Listings were at 463 at month end, up from 266 at the end of December 2017, Month’s Supply of Total Residential Listings is at 9 Months (Buyer’s Market) compared to 3 Months Supply at the end of 2017 and Sales to Listings Ratio was 63% in December 2018 compared to 99% in December 2017. Benchmark Price is down 1.6% (Detached homes down 8.2% and Apartments up 2.6%).

Burnaby South: Total Units Sold in December 2018 was 51 – down from 79 in November 2018; down from 109 in December 2017 and down from 73 in December 2016. Total Active Listings were at 627 at month end, up from 370 at the end of December 2017, Month’s Supply of Total Residential Listings is at 12 Months (Buyer’s Market) compared to 3 Months Supply at the end of 2017 and Sales to Listings Ratio was 50% in December 2018 compared to 96% in December 2017. Benchmark Price is down 1.6% (Detached homes down 6.6% and Apartments up 0.1%).

New Westminster: Total Units Sold in December 2018 was 58 – down from 87 in November 2018; down from 117 in December 2017 and down from 103 in December 2016. Total Active Listings were at 390 at month end, up from 187 at the end of December 2017, Month’s Supply of Total Residential Listings is at 7 Months (Buyer’s Market) compared to 2 Months Supply at the end of 2017 and Sales to Listings Ratio was 126% in December 2018 compared to 123% in December 2017. Benchmark Price is up 4.2% (Detached homes down 8.7% and Apartments up 7.4%).

Coquitlam: Total Units Sold in December 2018 was 89 – down from 135 in November 2018; down from 162 in December 2017 and down from 128 in December 2016. Total Active Listings were at 786 at month end, up from 487 at the end of December 2017, Month’s Supply of Total Residential Listings is at 9 Months (Buyer’s Market) compared to 3 Months Supply at the end of 2017 and Sales to Listings Ratio was 75% in December 2018 compared to 98% in December 2017. Benchmark Price is down 0.5% (Detached homes down 5.3% and Apartments up 3.2%).

Port Moody: Total Units Sold in December 2018 was 29 – down from 33 in November 2018; down from 38 in December 2017 and down from 41 in December 2016. Total Active Listings were at 169 at month end, up from 106 at the end of December 2017, Month’s Supply of Total Residential Listings is at 6 Months (Buyer’s Market) compared to 3 Months Supply at the end of 2017 and Sales to Listings Ratio was 181% in December 2018 compared to 106% in December 2017. Benchmark Price is down 0.2% (Detached homes down 1.1% and Apartments down 0.9%).

Port Coquitlam: Total Units Sold in December 2018 was 51 – down from 67 in November 2018; down from 71 in December 2017 and down from 59 in December 2016. Total Active Listings were at 259 at month end, up from 135 at the end of December 2017, Month’s Supply of Total Residential Listings is at 5 Months (Buyer’s Market) compared to 2 Months Supply at the end of 2017 and Sales to Listings Ratio was 128% in December 2018 compared to 109% in December 2017. Benchmark Price is down 0.7% (Detached homes down 4.9% and Apartments up 2.2%).

Ladner: Total Units Sold in December 2018 was 23 – up from 22 in November 2018; down from 26 in December 2017 and up from 21 in December 2016. Total Active Listings were at 143 at month end, up from 92 at the end of December 2017, Month’s Supply of Total Residential Listings is at 6 Months (Buyer’s Market) compared to 4 Months Supply at the end of 2017 and Sales to Listings Ratio was 164% in December 2018 compared to 163% in December 2017. Benchmark Price is down 2.8% (Detached homes down 6.3% and Apartments up 5.8%).

Tsawwassen: Total Units Sold in December 2018 was 13 – down from 17 in November 2018; the same as December 2017 and down from 15 in December 2016. Total Active Listings were at 171 at month end, up from 141 at the end of December 2017, Month’s Supply of Total Residential Listings is at 13 Months (Buyer’s Market) compared to 11 Months Supply at the end of 2017 and Sales to Listings Ratio was 100% in December 2018 compared to 100% in December 2017. Benchmark Price is down 4.4% (Detached homes down 7.0% and Apartments up 6.5%).


Kevin Skipworth

Dexter Realty

Partner/Broker

Read


  Happy New Year Everyone!

The BC Property Assessments for 2019 are available online now:

https://www.bcassessment.ca/

Please keep in mind these assessments were done last summer of  July 2018, so they don’t accurately portray today's market value.

Recent market activity is what will better reflect the market value, not these property assessments.

Your assessments for each property will be arriving in the mail in the coming days.

If you have any questions  . . . Call, Text or Email me I am here to help.


Wishing you all the Best for 2019,


Connie


604-916-9656

conniemcginleyrealty@gmail.com

Read

Metro Vancouver home sales decline below historical averages in 2018

Metro Vancouver home sales in 2018 were the lowest annual total in the region since 2000.

The Real Estate Board of Greater Vancouver (REBGV) reports that sales of detached, attached and apartment properties reached 24,619 on the Multiple Listing Service® (MLS®) in 2018, a 31.6 per cent decrease from the 35,993 sales recorded in 2017, and a 38.4 per cent decrease compared to the 39,943 residential sales in 2016.

Last year’s sales total was 25 per cent below the region’s 10-year sales average.

“This past year has been a transition period for the Metro Vancouver housing market away from the sellers’ market conditions we experienced in previous years,” Phil Moore, REBGV president said. “High home prices, rising interest rates and new mortgage requirements and taxes all contributed to the market conditions we saw in 2018.”

Home listings in Metro Vancouver reached 53,614 in 2018. This is a 1.9 per cent decrease compared to 54,655 homes listed in 2017 and a 6.9 per cent decrease compared to the 57,596 homes listed in 2016.

“The supply of homes for sale will be an important indicator to follow in 2019. We’ve had record building activity in recent years and many projects will complete soon. This will provide additional housing options for home buyers across the region,” Moore said.

The MLS® HPI composite benchmark price for all residential homes in Metro Vancouver ends the year at $1,032,400. This is a 2.7 per cent decrease compared to December 2017.

“As the total supply of homes for sale began to accumulate in the spring, we began to see downward pressure on prices across all home types throughout the latter half of the year,” Moore said.

The benchmark price of detached homes in the region declined 7.8 per cent over the last 12 months and 7.3 per cent since June 2018. Apartment homes increased 0.6 per cent over the last 12 months and have declined 6.4 per cent since June 2018. The benchmark price for townhomes in Metro Vancouver have increased 1.3 per cent since December 2017 and have decreased 5.3 per cent over the last six months.

December summary

REBGV reports that residential home sales in the region totalled 1,072 in December 2018, a 46.8 per cent decrease from the 2,016 sales recorded in December 2017, and a 33.3 per cent decrease from November 2018 when 1,608 homes sold.

Last month’s sales were 43.3 per cent below the 10-year December sales average.

There were 1,407 detached, attached and apartment homes newly listed for sale on the MLS® in Metro Vancouver in December 2018. This represents a 25.6 per cent decrease compared to the 1,891 homes listed in December 2017 and a 59.3 per cent decrease compared to November 2018 when 3,461 homes were listed.

The total number of homes currently listed for sale on the MLS® system in Metro Vancouver is 10,275, a 47.7 per cent increase compared to December 2017 (6,958) and a 16.5 per cent decrease compared to November 2018 (12,307).

For all property types, the sales-to-active listings ratio for December 2018 is 10.4 per cent. By property type, the ratio is 7.1 per cent for detached homes, 12 per cent for townhomes, and 14.2 per cent for apartments.

Generally, analysts say that downward pressure on home prices occurs when the ratio dips below the 12 per cent mark for a sustained period, while home prices often experience upward pressure when it surpasses 20 per cent over several months.

Sales of detached homes in December 2018 reached 348, a 43.6 per cent decrease from the 617 detached sales recorded in December 2017. The benchmark price for a detached home is $1,479,000. This represents a 7.8 per cent decrease from December 2017 and a 1.4 per cent decrease compared to November 2018.

Sales of apartment homes reached 535 in December 2018, a 34 per cent decrease compared to the 1,028 sales in December 2017. The benchmark price of an apartment home is $664,100. This represents a 0.6 per cent increase from December 2017 and a 0.6 per cent decrease compared to November 2018.

Attached home sales in December 2018 totalled 189, a 49.1 per cent decrease compared to the 371 sales in December 2017. The benchmark price of an attached home is $809,700. This represents a 1.3 per cent increase from December 2017 and a 1.1 per cent decrease compared to November 2018.

Read

Greater Vancouver Sales and Listings Report for November 2018

There were 1,633 homes sold of all types in Greater Vancouver in November this year compared with 2,831 sales in November last year and 2,255 homes sold in November 2016. This was 35 per cent below the 10-year average for November and the lowest level of sales in November since 2008 which had 930 homes sold that month. The second lowest amount for November was 2012 which saw 1,733 sales. While we are seeing the active listings decline to close out 2018, buyers who recognize opportunities are engaging while others await what they feel is the right time to engage in buying or selling to make a move to another home. There is significant pent up demand building in the market as a result. There were 518 Detached Houses sold in November 2018 down from 846 (down 38 per cent) in November 2017 in Greater Vancouver, and down from 643 in November 2016. For townhouses there were 282 sales in November 2018 compared to 446 in November 2017 (down 36 per cent), down from 446 November 2016 and for condos there were 810 sales in November 2018, a decrease in sales from 1,508 in November 2017 (down 46 per cent) and compared to 1,508 in November 2016. Detached sales amounts were more consistent so far this fall compared to the fall of 2017, it is the townhouse and apartment market where we are seeing the more significant declines in sales volumes.

As for supply in the market, there was a decrease in the number of new listings in November compared to October this year and November of last year. There were 3,553 new listings in November in Greater Vancouver, down 29 per cent from October and down 16 per cent from November last year. The number of new listings in November 2018 were 4 per cent above the 10-year average for November. Active Listings are at 12,978 for month end (up 38 per cent compared to November 2017). Active Listings are staying mostly stagnant year over year for detached properties but are up for townhouse and apartments. The number of active listings for detached are up 9 per cent year over year in Greater Vancouver while townhouses are up 56 per cent and apartments are up 106 per cent year over year.

“Home buyers have been taking a wait-and-see approach for most of 2018. This has allowed the number of homes available for sale in the region to return to more typical historical levels,” Phil Moore, Real Estate Board of Greater Vancouver president said. “This activity is helping home prices edge down, across all property types, from the record highs we’ve experienced over the last year. Home prices have declined between four and seven per cent over the last six months depending on property type.”

East of the Fraser River, the Fraser Valley Real Estate Board processed 1,028 sales of all property types on its Multiple Listing Service® in November, a decrease of 41 per cent compared to 1,743 sales in November of last year, and a 11 per cent increase compared to sales in October 2018. Of the 1,028 sales processed last month 241 were townhouses and 286 were apartments and 383 were detached homes. “Lessening demand continues to impact our market significantly,” said John Barbisan, Board President. “In turn, that has given purchasing power back to buyers who now have more time and more options when it comes to making a decision.”

Here’s a summary of the numbers:

Greater Vancouver: Total Units Sold in November 2018 was 1,633 – down from 1,995 (18%) in October 2018, down from 2,831 (42%) in November 2017, down from 2,255 (28%) in November 2016; Active Listings are at 12,978 compared to 9,369 (up 39%) at this time last year; New Listings in November 2018 were down 16% compared to November 2017 and up 10% compared to November 2016; Month’s Supply of Total Residential Listings is up to 8 Month’s Supply (Buyer’s Market) and a Sales to Listings Ratio of 46% compared to 67% in November 2017.

Vancouver Westside Residential: Total Units Sold in November 2018 was 298 – down from 381 (22%) in October 2018, down from 505 (41%) in November 2017, down from 408 (27%) in November 2016; Active Listings are at 2,361 compared to 1,607 (up 47%) at this time last year; New Listings in November 2018 were down 4% compared to November 2017 and up 22% compared to November 2016; Month’s Supply of Total Residential Listings is up to 8 Month’s Supply (Buyer’s Market) and a Sales to Listings Ratio of 43% compared to 69% in November 2017.

Vancouver Eastside Residential: Total Units Sold in November 2018 was 181 – down from 234 (23%) in October 2018, down from 315 (43%) in November 2017, down from 251 (28%) in November 2016; Active Listings are at 1,314 compared to 1,153 (up 14%) at this time last year; New Listings in November 2018 were down 26% compared to November 2017 and down 8% compared to November 2016; Month’s Supply of Total Residential Listings is up to 7 Month’s Supply (Buyer’s Market) and a Sales to Listings Ratio of 47% compared to 61% in November 2017.

North Vancouver Residential: Total Units Sold in November 2018 was 139 – down from 173 (20%) in October 2018, down from 250 (45%) in November 2017, down from 173 (20%) in November 2016; Active Listings are at 854 compared to 595 (up 44%) at this time last year; New Listings in November 2018 were down 23% compared to November 2017 and up 32% compared to November 2016; Month’s Supply of Total Residential Listings is up to 6 Month’s Supply (Buyer’s Market) and a Sales to Listings Ratio of 48% compared to 66% in November 2017.

West Vancouver Houses: Total Units Sold in November 2018 was 30 – down from 55 (45%) in October 2018, down from 57 (47%) in November 2017, down from 44 (32%) in November 2016; Active Listings are at 705 compared to 626 (up 13%) at this time last year; New Listings in November 2018 were down 17% compared to November 2017 and up 29% compared to November 2016; Month’s Supply of Total Residential Listings is up to 24 Month’s Supply (Buyer’s Market) and a Sales to Listings Ratio of 21% compared to 33% in November 2017.

Richmond Residential: Total Units Sold in November 2018 was 178 – down from 230 (23%) in October 2018, down from 350 (49%) in November 2017, down from 262 (32%) in November 2016; Active Listings are at 1,809 compared to 1,419 (up 27%) at this time last year; New Listings in November 2018 were down 27% compared to November 2017 and up 7% compared to November 2016; Month’s Supply of Total Residential Listings is up to 10 Month’s Supply (Buyer’s Market) and a Sales to Listings Ratio of 39% compared to 56% in November 2017.

Burnaby East: Total Units Sold in November 2018 was 17 – the same as October 2018, down from 30 (33%) in November 2017, down from 30 (33%) in November 2016; Active Listings are at 142 compared to 129 (up 10%) at this time last year; New Listings in November 2018 were down 36% compared to November 2017 and down 13% compared to November 2016; Month’s Supply of Total Residential Listings is down to 8 Month’s Supply (Buyer’s Market) and a Sales to Listings Ratio of 50% compared to 57% in November 2017.

Burnaby North: Total Units Sold in November 2018 was 71 – down from 76 (7%) in October 2018, down from 144 (51%) in November 2017, down from 121 (41%) in November 2016; Active Listings are at 547 compared to 331 (up 71%) at this time last year; New Listings in November 2018 were down 10% compared to November 2017 and up 21% compared to November 2016; Month’s Supply of Total Residential Listings is up to 8 Month’s Supply (Buyer’s Market) and a Sales to Listings Ratio of 42% compared to 76% in November 2017.

Burnaby South: Total Units Sold in November 2018 was 79 – down from 87 (9%) in October 2018, down from 148 (47%) in November 2017, down from 98 (20%) in November 2016; Active Listings are at 688 compared to 454 (up 51%) at this time last year; New Listings in November 2018 were down 24% compared to November 2017 and up 19% compared to November 2016; Month’s Supply of Total Residential Listings is up to 9 Month’s Supply (Buyer’s Market) and a Sales to Listings Ratio of 42% compared to 21% in November 2017.

New Westminster: Total Units Sold in November 2018 was 87 – down from 88 (1%) in October 2018, down from 184 (53%) in November 2017, down from 97 (10%) in November 2016; Active Listings are at 491 compared to 257 (up 91%) at this time last year; New Listings in November 2018 were down 11% compared to November 2017 and up 16% compared to November 2016; Month’s Supply of Total Residential Listings is steady at 6 Month’s Supply (Buyer’s Market) and a Sales to Listings Ratio of 53% compared to 91% in November 2017.

Coquitlam: Total Units Sold in November 2018 was 135 – down from 136 (2%) in October 2018, down from 228 (41%) in November 2017, down from 174 (22%) in November 2016; Active Listings are at 935 compared to 606 (up 54%) at this time last year; New Listings in November 2018 were down 19% compared to November 2017 and up 13% compared to November 2016; Month’s Supply of Total Residential Listings is down to 7 Month’s Supply (Buyer’s Market) and a Sales to Listings Ratio of 51% compared to 71% in November 2017.

Port Moody: Total Units Sold in November 2018 was 33 – down from 36 (3%) in October 2018, down from 73 (55%) in November 2017, down from 38 (13%) in November 2016; Active Listings are at 219 compared to 139 (up 58%) at this time last year; New Listings in November 2018 were down 10% compared to November 2017 and the same compared to November 2016; Month’s Supply of Total Residential Listings is steady at 7 Month’s Supply (Buyer’s Market) and a Sales to Listings Ratio of 47% compared to 94% in November 2017.

Port Coquitlam: Total Units Sold in November 2018 was 67 – down from 75 (11%) in October 2018, down from 94 (20%) in November 2017, down from 96 (30%) in November 2016; Active Listings are at 335 compared to 168 (up 99%) at this time last year; New Listings in November 2018 were down 2% compared to November 2017 and up 39% compared to November 2016; Month’s Supply of Total Residential Listings is steady at 5 Month’s Supply (Balanced Market) and a Sales to Listings Ratio of 55% compared to 75% in November 2017.

Ladner: Total Units Sold in November 2018 was 22 – down from 30 (27%) in October 2018, down from 26 (15%) in November 2017, down from 27 (19%) in November 2016; Active Listings are at 177 compared to 127 (up 39%) at this time last year; New Listings in November 2018 were up 10% compared to November 2017 and up 7% compared to November 2016; Month’s Supply of Total Residential Listings is up to 8 Month’s Supply (Buyer’s Market) and a Sales to Listings Ratio of 50% compared to 65% in November 2017.

Tsawwassen: Total Units Sold in November 2018 was 17 – down from 25 (32%) in October 2018, down from 24 (29%) in November 2017, down from 30 (43%) in November 2016; Active Listings are at 219 compared to 174 (up 26%) at this time last year; New Listings in November 2018 were down 21% compared to November 2017 and down 34% compared to November 2016; Month’s Supply of Total Residential Listings is up to 13 Month’s Supply (Buyer’s Market) and a Sales to Listings Ratio of 45% compared to 50% in November 2017.

Kevin Skipworth

Dexter Realty

Partner/Broker

Read

Metro Vancouver Market Update for October 2018

Attached are the Sales and Listings Stats updated to the end of October 2018. Two things came in October – rain and a few more sales in the market. As is the case with October, activity does increases as do the number of new listings.

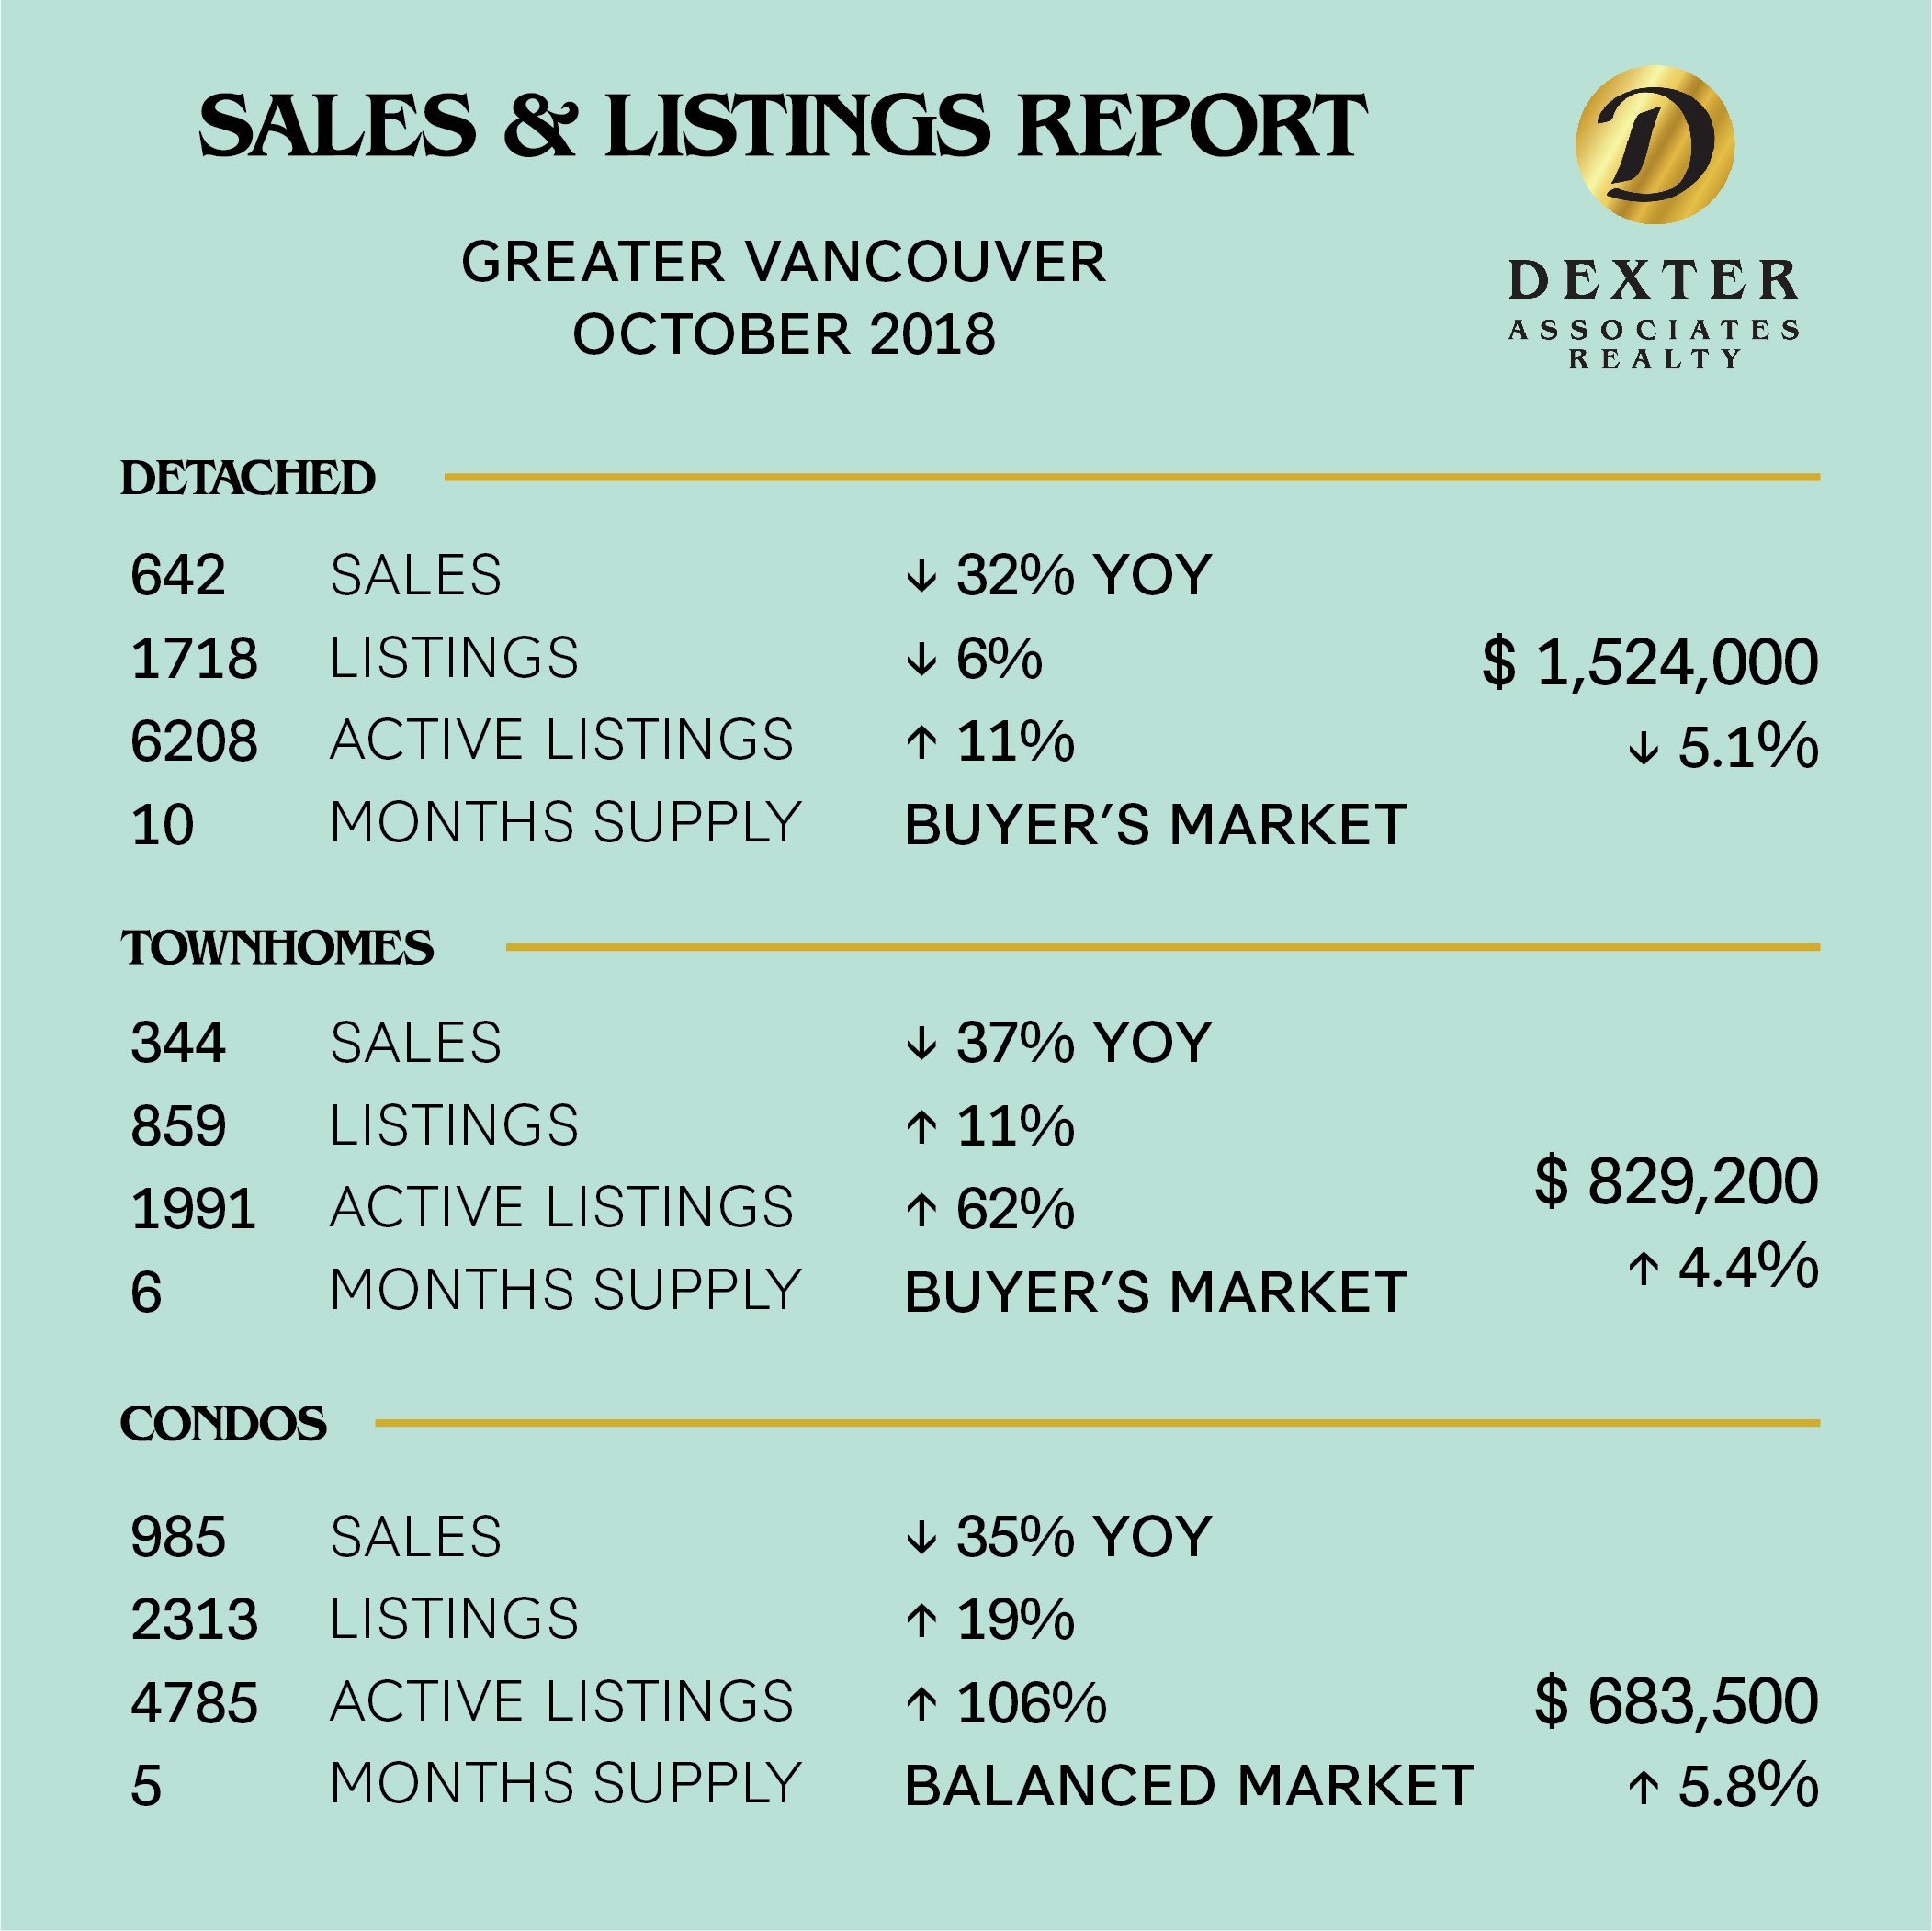
There were 1,995 homes sold of all types in Greater Vancouver in October this year compared with 3,073 sales in October last year and 2,284 homes sold in October 2016. This was 27 per cent below the 10 year average for October and almost the same level as October 2012 at 1,979. In fact, when we look at 2012, so far, each month has tracked very similar for sales levels. With the main difference being the inventory levels. – much lower than in 2012. There continues to be a hesitation in the market right now While prices on the detached side of the market have been falling over the last year, we are now seeing this occur in the apartment and townhouse market in some areas and product types.  There were 642 Detached Houses sold in October 2018 down from 945 (down 38 per cent) in October 2017 in Greater Vancouver, and down from 659 in October 2016. For townhouses there were 344 sales in October 2018 compared to 550 in October 2017 (down 37 per cent), down from 403 October 2016 and for condos there were 985 sales in October 2018, a decrease in sales from 1,532 in October 2017 (down 36 per cent) and compared to 1,178 in September 2016. Overall there has been an increase in market activity for October compared to November as we typically see. Although the bigger increases in homes sold has been in Vancouver, North Vancouver and West Vancouver. Ladner actually saw less sales in October compared to September and areas like Burnaby, New Westminster and the Tri-Cities saw lower per centage gains in comparison. The average prices in those areas also dropped while Vancouver saw a gain.

As for supply in the market, there was an increase in the number of new listings in October compared to October of last year. There were 5,026 new listings in October in Greater Vancouver, up 8 per cent from October last year and up from 4,066 or 23 per cent from October 2016. The number of new listings in September 2018 were just above the 11 year average for September. Active Listings are at 13,682 for month end (up 36 per cent compared to October). Active Listings fell from 13,760 in September 2018 and will continue to do so as the year finishes. At the end of October 2012, the Active Listing count was 18,519 – 35 per cent higher than in today’s market. A significant difference from the last down market and indicative of strength in the market overall.

“The supply of homes for sale today is beginning to return to levels that we haven’t seen in our market in about four years,” Phil Moore, Real Estate Board of Greater Vancouver president said. “For home buyers, this means you have more selection to choose from. For sellers, it means your home may face more competition, from other listings, in the marketplace. Home prices have edged down between three and fiver per cent, depending on housing type, in our region since June. This is providing a little relief for those looking to buy compared to the all-time highs we’ve experienced over the last year.

East of the Fraser River, the Fraser Valley Real Estate Board processed 1,155 sales of all property types on its Multiple Listing Service® in October, a decrease of 36 per cent compared to 1,779 sales in October of last year, and a 12 per cent increase compared to sales in September 2018. Of the 1,155 sales processed last month 306 were townhouses and 292 were apartments and 438 were detached homes. While slight, this is the first time since May that sales here have been on the upswing,” said John Barbisan, Board President. “We’re beneath typical activity levels for this time of year but it’s good to see that buyers and sellers are still finding success this season.”

Here’s a summary of the numbers:

Greater Vancouver: Total Units Sold in October 2018 was 1,995 – up from 1,634 (22%) in September 2018, down from 3,073 (35%) in October 2017, down from 2,284 (13%) in October 2016; Active Listings are at 13,682 compared to 9,768 (up 40%) at this time last year; New Listings in October 2018 were up 8% compared to October 2017 and up 24% compared to October 2016; Month’s Supply of Total Residential Listings is down to 7 Month’s Supply (Buyer’s Market) and a Sales to Listings Ratio of 40% compared to 66% in October 2017.

Vancouver Westside Residential: Total Units Sold in October 2018 was 381 – up from 280 (36%) in September 2018, down from 556 (31%) in October 2017, down from 408 (7%) in October 2016; Active Listings are at 2,459 compared to 1,725 (up 43%) at this time last year; New Listings in October 2018 were up 10% compared to October 2017 and up 35% compared to October 2016; Month’s Supply of Total Residential Listings is down to 6 Month’s Supply (Buyer’s Market) and a Sales to Listings Ratio of 37% compared to 60% in October 2017.

Vancouver Eastside Residential: Total Units Sold in October 2018 was 234 – up from 195 (20%) in September 2018, down from 298 (21%) in October 2017, up from 202 (16%) in October 2016; Active Listings are at 1,409 compared to 1,168 (up 21%) at this time last year; New Listings in October 2018 were down 5% compared to October 2017 and up 6% compared to October 2016; Month’s Supply of Total Residential Listings is down to 6 Month’s Supply (Buyer’s Market) and a Sales to Listings Ratio of 44% compared to 54% in October 2017.

North Vancouver Residential: Total Units Sold in October 2018 was 173 – up from 120 (44%) in September 2018, down from 250 (31%) in October 2017, up from 170 (2%) in October 2016; Active Listings are at 938 compared to 604 (up 55%) at this time last year; New Listings in October 2018 were up 15% compared to October 2017 and up 50% compared to October 2016; Month’s Supply of Total Residential Listings is down to 5 Month’s Supply (Balanced Market) and a Sales to Listings Ratio of 37% compared to 61% in October 2017.

West Vancouver Houses: Total Units Sold in October 2018 was 55 – up from 34 (62%) in September 2018, up from 46 (20%) in October 2017, up from 35 (57%) in October 2016; Active Listings are at 743 compared to 652 (up 14%) at this time last year; New Listings in October 2018 were up 6% compared to October 2017 and up 48% compared to October 2016; Month’s Supply of Total Residential Listings is down to 14 Month’s Supply (Buyer’s Market) and a Sales to Listings Ratio of 26% compared to 23% in October 2017.

Richmond Residential: Total Units Sold in October 2018 was 230 – up from 196 (17%) in September 2018, down from 411 (44%) in October 2017, down from 290 (20%) in October 2016; Active Listings are at 1,878 compared to 1,408 (up 33%) at this time last year; New Listings in October 2018 were down 6% compared to October 2017 and up 15% compared to October 2016; Month’s Supply of Total Residential Listings is down to 8 Month’s Supply (Buyer’s Market) and a Sales to Listings Ratio of 39% compared to 66% in October 2017.

Burnaby East: Total Units Sold in October 2018 was 17 – up from 11 (54%) in September 2018, down from 22 (45%) in October 2017, down from 22 (45%) in October 2016; Active Listings are at 148 compared to 127 (up 17%) at this time last year; New Listings in October 2018 were down 13% compared to October 2017 and up 8% compared to October 2016; Month’s Supply of Total Residential Listings is down to 9 Month’s Supply (Buyer’s Market) and a Sales to Listings Ratio of 33% compared to 37% in October 2017.

Burnaby North: Total Units Sold in October 2018 was 76 – down from 83 (8%) in September 2018, down from 161 (53%) in October 2017, down from 121 (40%) in October 2016; Active Listings are at 556 compared to 383 (up 45%) at this time last year; New Listings in October 2018 were up 28% compared to October 2017 and up 26% compared to October 2016; Month’s Supply of Total Residential Listings is down to 7 Month’s Supply (Buyer’s Market) and a Sales to Listings Ratio of 30% compared to 82% in October 2017.

Burnaby South: Total Units Sold in October 2018 was 87 – up from 82 (6%) in September 2018, down from 184 (53%) in October 2017, down from 103 (16%) in October 2016; Active Listings are at 693 compared to 450 (up 54%) at this time last year; New Listings in October 2018 were up 25% compared to October 2017 and up 57% compared to October 2016; Month’s Supply of Total Residential Listings is steady at 8 Month’s Supply (Buyer’s Market) and a Sales to Listings Ratio of 31% compared to 81% in October 2017.

New Westminster: Total Units Sold in October 2018 was 88 – up from 81 (9%) in September 2018, down from 152 (53%) in October 2017, down from 106 (17%) in October 2016; Active Listings are at 511 compared to 282 (up 81%) at this time last year; New Listings in October 2018 were up 22% compared to October 2017 and up 62% compared to October 2016; Month’s Supply of Total Residential Listings is steady at 6 Month’s Supply (Buyer’s Market) and a Sales to Listings Ratio of 36% compared to 77% in October 2017.

Coquitlam: Total Units Sold in October 2018 was 136 – up from 131 (4%) in September 2018, down from 248 (55%) in October 2017, down from 183 (26%) in October 2016; Active Listings are at 1,026 compared to 662 (up 55%) at this time last year; New Listings in October 2018 were up 9% compared to October 2017 and up 18% compared to October 2016; Month’s Supply of Total Residential Listings is steady at 8 Month’s Supply (Buyer’s Market) and a Sales to Listings Ratio of 37% compared to 73% in October 2017.

Port Moody: Total Units Sold in October 2018 was 36 – up from 34 (6%) in September 2018, down from 76 (53%) in October 2017, down from 65 (45%) in October 2016; Active Listings are at 242 compared to 160 (up 51%) at this time last year; New Listings in October 2018 were down 30% compared to October 2017 and down 20% compared to October 2016; Month’s Supply of Total Residential Listings is steady at 7 Month’s Supply (Buyer’s Market) and a Sales to Listings Ratio of 51% compared to 75% in October 2017.

Port Coquitlam: Total Units Sold in October 2018 was 75 – up from 73 (3%) in September 2018, down from 120 (37%) in October 2017, down from 93 (19%) in October 2016; Active Listings are at 357 compared to 170 (up 110%) at this time last year; New Listings in October 2018 were up 23% compared to October 2017 and up 9% compared to October 2016; Month’s Supply of Total Residential Listings is steady at 5 Month’s Supply (Balanced Market) and a Sales to Listings Ratio of 46% compared to 91% in October 2017.

Ladner: Total Units Sold in October 2018 was 21 – down from 30 (30%) in September 2018, down from 31 (33%) in October 2017, down from 27 (23%) in October 2016; Active Listings are at 187 compared to 121 (up 55%) at this time last year; New Listings in October 2018 were up 29% compared to October 2017 and down 3% compared to October 2016; Month’s Supply of Total Residential Listings is up to 9 Month’s Supply (Buyer’s Market) and a Sales to Listings Ratio of 32% compared to 61% in October 2017.

Tsawwassen: Total Units Sold in October 2018 was 25 – the same as September 2018, down from 40 (37%) in October 2017, up from 24 (24%) in October 2016; Active Listings are at 230 compared to 179 (up 28%) at this time last year; New Listings in October 2018 were up 6% compared to October 2017 and up 36% compared to October 2016; Month’s Supply of Total Residential Listings is down to 9 Month’s Supply (Buyer’s Market) and a Sales to Listings Ratio of 37% compared to 63% in October 2017.

Kevin Skipworth

Dexter Realty

Partner/Broker

Read

TOP 10 TIPS for getting a Mortgage

The ten principles of applying for a Mortgage

  1. Do not change jobs, become self-employed or quit your job.

A strong and steady employment history is essential.

  1. Do not buy a car, truck or van (or you may be living in it!!)

Some lenders will check your credit just prior to funding the mortgage. If anything shows up that hinders your ability to repay their new mortgage to you, such as a new car loan, they could refuse to fund the mortgage.

  1. Do not use credit cards excessively or let current accounts fall behind.

If there have been substantial changes in any of your credit cards, bank loans or lines of credit, this could alter your purchasing power.

  1. Set aside money for closing costs at the start of the process.

In addition to the down payment on the purchase, you will need to pay the lawyer/notary all of the closing costs. Closing costs include: Property Transfer Tax (if applicable), property tax adjustments, strata fee adjustments, and the legal fees.

  1. Do not omit debts or liabilities from your loan application.

They will show up on the credit bureau.

  1. Do not ‘go shopping’ for a mortgage with multiple applications.

Submitting a second application with a different broker will have negative results. If you have questions, ask your broker!

  1. Do not originate multiple inquiries into your credit.

If you have applied for a couple of new credit cards or accepted the new bank account with a large overdraft privilege, you may appear as a ‘credit seeker’ and that could compromise your ability to repay a new mortgage.

  1. Do not make large cash deposits or transfers without checking with your mortgage broker.

  1. Do not change bank accounts.

Financial history has to be provided for down payment funds, in some cases up to 90 days

  1. Do not co-sign a loan for anyone else.

If the person you co-signed for is unable to make their payments (for whatever reason) that lender is coming after you for the payments and/or the balance of the loan.

Read

WE ARE MOVING!

Today was the last full day at our Dexter Realty Kerrisdale offices at 43rd and East Boulevard!
29 years at this location and over 35 years of helping #buyers and #sellers
#beyondexpectations
Can't wait to be our brand new offices at:
#560-2608 Granville Street (at 10th Avenue above the #potterybarn ) 
#southgranville
#vancouver
#realestate
Serving #greatervancouver
#lovewhereyouwork
#lovewhatyoudo
#lovewhereyoulive❤️
#DexterRealtySince1983
#aboldmove

Read
Reciprocity Logo The data relating to real estate on this website comes in part from the MLS® Reciprocity program of either the Greater Vancouver REALTORS® (GVR), the Fraser Valley Real Estate Board (FVREB) or the Chilliwack and District Real Estate Board (CADREB). Real estate listings held by participating real estate firms are marked with the MLS® logo and detailed information about the listing includes the name of the listing agent. This representation is based in whole or part on data generated by either the GVR, the FVREB or the CADREB which assumes no responsibility for its accuracy. The materials contained on this page may not be reproduced without the express written consent of either the GVR, the FVREB or the CADREB.