
“Character is much easier kept than recovered.” Thomas Paine
This is no longer a comeback! This is a real estate market making its own way into 2021. This is well beyond pent up demand and more like a surge of moves being made for a variety of reasons. Those buying and selling have had more confidence in the real estate market than did the federal organization that insures mortgages in Canada – and true to form, the customer is always right!
There were 3,181 properties sold of all types in Greater Vancouver in November this year compared with 3,787 sold last month, 2,546 sales in November last year and 1,633 sold in November 2018. It was the fifth highest amount of sales for the month of November on record in Greater Vancouver, and the highest for the month since 2015 at 3,603. Total sales for 2020 have already exceeded the total number of sales in 2018 and 2019 with December still to come. Instances of multiple offers are still occurring at a rate we’ve not seen in the last few years in Metro Vancouver, with some reports showing that a quarter of transactions are selling at list price or above. While more so in detached homes and townhouses, there is still activity in the apartment market that has created competition. While downtown Vancouver has seen less activity in comparison, there are still quite a number of transactions occurring. Inventory of apartments for sale has increased from extreme seller’s market conditions in 2017, and yet the total is still much less than the number of listings on market in 2011 and 2012. As we move into 2021 and the potential for some relief from the pandemic comes, the push away from high rise apartments should relax. When immigration opens up again and service sector jobs return, demand for apartments will increase with it – both to purchase and rent.
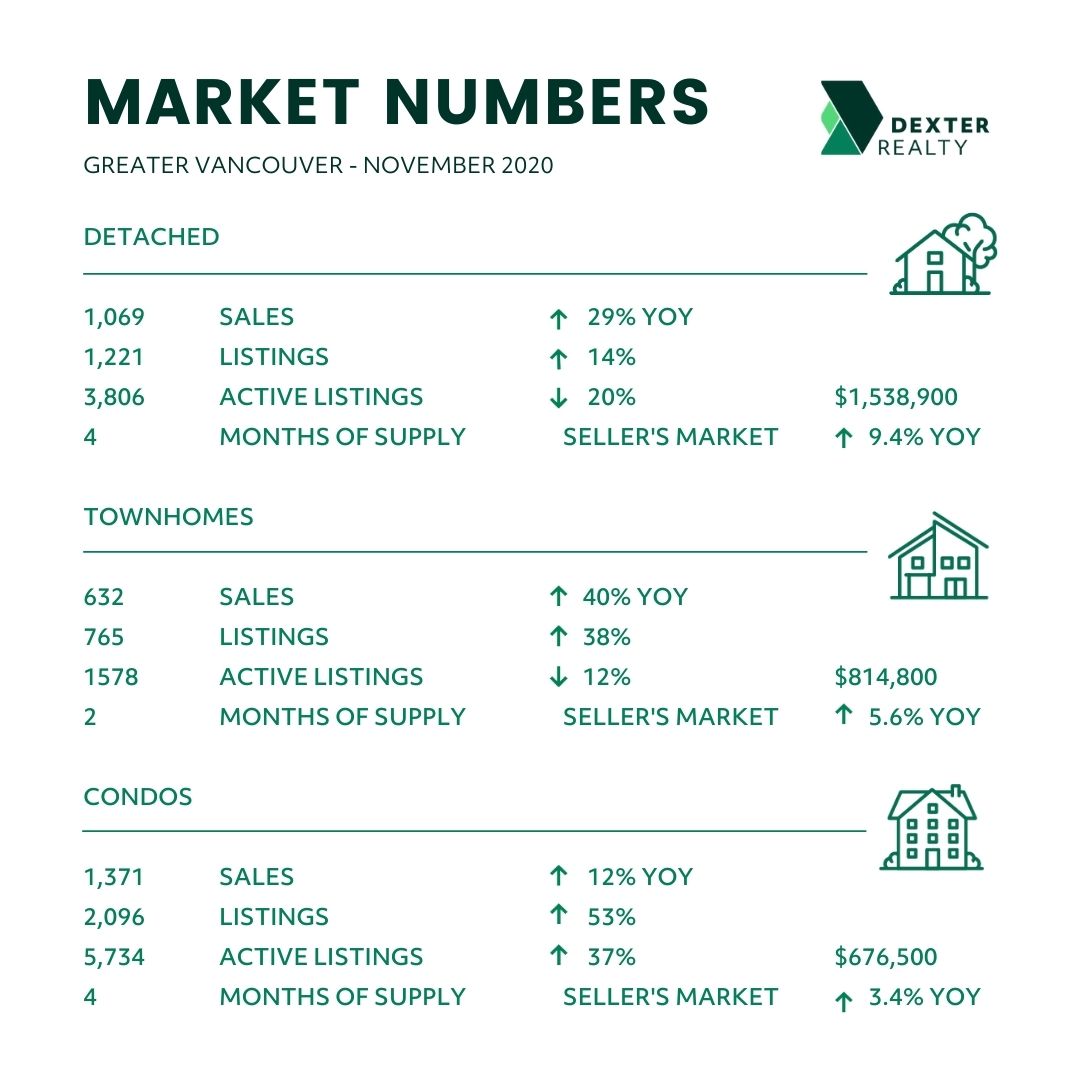
Total sales in November were 25 per cent above the ten-year average for the month. Looking at the different types of properties, detached home sales were up 29 per cent year over year (43 per cent in October), townhouses up 40 per cent year over year (45 per cent in October), apartments up 12 per cent year over year (13 per cent in October). Detached homes made up 34 per cent of all sales (35 per cent in October), while townhomes made up 21 per cent (up from 20 per cent in October) and apartments 44 (up from 41) per cent. Total active listings for apartments are up 37 per cent year over year (compared to 31 per cent at the end of October), and active listings for townhouse and detached homes are down 12 per cent and 20 per cent respectively year over year.
2020 Average Daily Listings and Sales in Greater Vancouver by Week:
First two weeks of March – 253 new listings, 138 sales
Last two weeks of March – 167 New Listings, 98 Sales
April – 120 new listings, 56 sales
May – 189 new listings, 75 sales
June – 274 new listings, 115 sales
July – 274 new listings, 147 sales
August - 299 new listings, 157 sales
September – 313 new listings, 176 sales
October – 272 new listings, 182 sales
November 2 to 6 – 236 new listings, 151 sales
November 9 to 13 – 253 new listings, 188 sales
November 16 to 20 – 191 new listings, 155 sales
November 23 to 27 – 166 new listings, 149 sales
The number of new listings coming to market continued to decline in November with total active listings declining as well. Even though the number of new listings in November were 21 per cent above the 10-year average for the month, the total number of active listings at the end of November dropped to 11,716 from 13,066 at the end of October. While slightly above last year’s number of active listings which were 11,517 at the end of November 2019, with buyer demand continuing at the level we’ve seen in the second half of 2020, there will be less than 10,000 total active listings at the end of the year. While December is typically a time to hold off listing a home for sale, this year is a much different year, opportunity exists for those in need of making a move. And with more and more consumer activity happening on line, there will be more eyes shifting to real estate websites after visits to Amazon and other online shopping sites.
With one month left in 2020, it’s become clear that despite a pandemic, the real estate market has been driven by real demand and created a shortage of resale homes to be available for buyers to choose from. The month’s supply of listings since June have been the lowest in over two years for detached and townhouse type properties. While the number of apartments has gone up in Vancouver’s West Side, there has been a clear shift towards buying further out in Greater Vancouver. Looking at areas such as Coquitlam, Coquitlam, Pitt Meadows, Maple Ridge and Lander, there 2 month’s supply of homes available. In Ladner, at the peak in June 2018 there were 131 houses available for sale, there are now 58; and for townhouses in Ladner, there were 46 available for sale in May 2019 and there are now 13. In Port Coquitlam in August 2018 there were 159 houses available for sale, there are now 53 and for townhouses there were 102 available in April 2019 and there are now only 26 on the market.
“Home buyer demand has been at near record levels in our region since the summer,” Colette Gerber, REBGV Chair said, “This is putting upward pressure on home prices, particularly in our detached and townhome markets. The supply of homes for sale are a critical factor in understanding home price trends. The total number of homes for sale in Metro Vancouver is lagging behind the pace of demand right now. This trend favours home sellers in today’s market.”
East of Vancouver, the Fraser Valley Real Estate Board processed 2,173 sales of all property types on its Multiple Listing Service® in November, a decrease of 8.3 per cent compared to sales in October and a 54.7 per cent increase compared to November last year. This was the highest sales for the month of November in the Fraser Valley Board, a continued trend from September. There were 2,217 new listings in November, a 28.0 per cent decrease compared to October and an 18.1 per cent increase compared to November of last year. November finished with 5,847 active listings, a decrease of 14.9 per cent compared to October’s inventory and a decrease of 13.2 per cent year-over-year. “We’re running out of superlatives. We expected November activity to moderate due to the season, but the desire for family-sized homes and their benefits continues to dominate. Since the summer, we’ve seen the strongest demand in our Board’s 99-year history specifically for single-family detached and townhomes.” Chris Shields, President of the Fraser Valley Real Estate Board said. “For example, in Cloverdale, demand for detached homes exceeded supply; and in four of our communities the sales-to-actives ratio for townhomes was 50 per cent or more. Meaning, for every 100 active listings, 50 were selling.”
Here’s a summary of the numbers:
Greater Vancouver: Total Units Sold in November were 3,131 – down from 3,787 (16%) in October 2020, up from 2,546 (23%) in November 2019, up from 1,633 (90%) in November 2018; Active Listings are at 11,716 compared to 11,517 at this time last year and 13,066 at the end of October; New Listings in November were down 27% compared to October 2020, up 35% compared to November 2019 and up 17% compared to November 2018. Month’s supply of total residential listings is up to 4 month’s supply (mostly seller’s market conditions with some areas of balanced conditions) and sales to listings ratio of 75% compared to 67% in October 2020, 83% in November 2019 and 46% in November 2018. Year-over-year, the House Price Index is up 5.8%.
Vancouver Westside: Total Units Sold in November were 470 – down from 547 (14%) in October 2020, up from 406 (16%) in November 2019, up from 298 (57%) in November 2018; Active Listings are at 2,558 compared to 2,065 at this time last year and 2,820 at the end of October; New Listings in November were down 30% compared to October 2020, up 41% compared to November 2019 and up 15% compared to November 2018. Month’s supply of total residential listings is steady at 5 month’s supply (mostly balanced market conditions with some areas of seller’s market conditions) and sales to listings ratio of 59% compared to 46% in October 2020, 72% in November 2019 and 43% in November 2018. Year-over-year, the House Price Index is up 2.6%.
Vancouver East Side: Total Units Sold in November were 364 – down from 392 (7%) in October 2020, up from 310 (17%) in November 2019, up from 181 (101%) in November 2018; Active Listings are at 1,232 compared to 1,006 at this time last year and 1,383 at the end of October; New Listings in November were down 31% compared to October 2020, up 41% compared to November 2019 and up 24% compared to November 2018. Month’s supply of total residential listings is down to 3 month’s supply (mostly seller’s market conditions with some areas of balanced conditions) and sales to listings ratio of 76% compared to 57% in October 2020, 91% in November 2019 and 47% in November 2018. Year-over-year, the House Price Index is up 6.1%.
North Vancouver: Total Units Sold in November were 264 – down from 334 (21%) in October 2020, up from 217 (22%) in November 2019, up from 139 (90%) in November 2018; Active Listings are at 693 compared to 656 at this time last year and 824 at the end of October; New Listings in November were down 25% compared to October 2020, up 47% compared to November 2019 and up 15% compared to November 2018. Month’s supply of total residential listings is up to 4 month’s supply (mostly seller’s market conditions with some areas of balanced conditions) and sales to listings ratio of 75% compared to 67% in October 2020, 83% in November 2019 and 46% in November 2018. Year-over-year, the House Price Index is up 9.3%.
West Vancouver: Total Units Sold in November were 90 – down from 104 (13%) in October 2020, up from 66 (36%) in November 2019, up from 30 (200%) in November 2018; Active Listings are at 558 compared to 608 at this time last year and 630 at the end of October; New Listings in November were down 44% compared to October 2020, down 3% compared to November 2019 and up 20% compared to November 2018. Month’s supply of total residential listings is steady at 6 month’s supply (mostly balanced conditions) and sales to listings ratio of 80% compared to 50% in October 2020, 56% in November 2019 and 21% in November 2018. Year-over-year, the House Price Index is up 8.1%.
Richmond: Total Units Sold in November were 335 – down from 384 (13%) in October 2020, up from 273 (22%) in November 2019, up from 178 (88%) in November 2018; Active Listings are at 1,637 compared to 1,795 at this time last year and 1,637 at the end of October; New Listings in November were down 16% compared to October 2020, up 36% compared to November 2019 and up 15% compared to November 2018. Month’s supply of total residential listings is up to 5 month’s supply (mostly balanced market conditions with some areas of seller’s market conditions) and sales to listings ratio of 64% compared to 62% in October 2020, 71% in November 2019 and 39% in November 2018. Year-over-year, the House Price Index is up 5.3%.
Burnaby East: Total Units Sold in November were 37 – down from 50 (26%) in October 2020, up from 33 (12%) in November 2019, up from 17 (118%) in November 2018; Active Listings are at 105 compared to 135 at this time last year and 124 at the end of October; New Listings in November were down 39% compared to October 2020, up 3% compared to November 2019 and up 12% compared to November 2018. Month’s supply of total residential listings is up to 3 month’s supply (mostly seller’s market conditions) and sales to listings ratio of 97% compared to 81% in October 2020, 89% in November 2019 and 50% in November 2018. Year-over-year, the House Price Index is up 6.7%.
Burnaby North: Total Units Sold in November were 156 – down from 170 (8%) in October 2020, up from 137 (14%) in November 2019, up from 71 (120%) in November 2018; Active Listings are at 594 compared to 439 at this time last year and 627 at the end of October; New Listings in November were down 13% compared to October 2020, up 87% compared to November 2019 and up 44% compared to November 2018. Month’s supply of total residential listings is up to 4 month’s supply (mostly seller’s market conditions with some areas of balanced conditions) and sales to listings ratio of 63% compared to 60% in October 2020, 104% in November 2019 and 42% in November 2018. Year-over-year, the House Price Index is up 4.7%.
Burnaby South: Total Units Sold in November were 159 – down from 178 (11%) in October 2020, down from 167 (5%) in November 2019, up from 79 (101%) in November 2018; Active Listings are at 669 compared to 607 at this time last year and 744 at the end of October; New Listings in November were down 32% compared to October 2020, up 17% compared to November 2019 and up 10% compared to November 2018. Month’s supply of total residential listings is up to 4 month’s supply (mostly seller’s market conditions with some areas of balanced conditions) and sales to listings ratio of 78% compared to 59% in October 2020, 96% in November 2019 and 42% in November 2018. Year-over-year, the House Price Index is up 2.9%.
New Westminster: Total Units Sold in November were 137 – down from 168 (18%) in October 2020, up from 123 (11%) in November 2019, up from 87 (57%) in November 2018; Active Listings are at 462 compared to 335 at this time last year and 520 at the end of October; New Listings in November were down 38% compared to October 2020, up 73% compared to November 2019 and up 3% compared to November 2018. Month’s supply of total residential listings is steady at 3 month’s supply (mostly seller’s market conditions) and sales to listings ratio of 82% compared to 62% in October 2020, 127% in November 2019 and 53% in November 2018. Year-over-year, the House Price Index is up 5.1%.
Coquitlam: Total Units Sold in November were 260 – down from 356 (27%) in October 2020, up from 210 (24%) in November 2019, up from 135 (93%) in November 2018; Active Listings are at 782 compared to 753 at this time last year and 844 at the end of October; New Listings in November were down 18% compared to October 2020, up 72% compared to November 2019 and up 42% compared to November 2018. Month’s supply of total residential listings is up to 3 month’s supply (mostly seller’s market conditions) and sales to listings ratio of 70% compared to 78% in October 2020, 97% in November 2019 and 51% in November 2018. Year-over-year, the House Price Index is up 7.6%.
Port Moody: Total Units Sold in November were 67 – down from 92 (27%) in October 2020, up from 43 (56%) in November 2019, up from 33 (103%) in November 2018; Active Listings are at 226 compared to 182 at this time last year and 254 at the end of October; New Listings in November were down 31% compared to October 2020, up 77% compared to November 2019 and up 22% compared to November 2018. Month’s supply of total residential listings is steady at 3 month’s supply (mostly seller’s market conditions) and sales to listings ratio of 79% compared to 75% in October 2020, 90% in November 2019 and 47% in November 2018. Year-over-year, the House Price Index is up 5.3%.
Port Coquitlam: Total Units Sold in November were 102 – down from 122 (16%) in October 2020, up from 90 (13%) in November 2019, up from 67 (52%) in November 2018; Active Listings are at 199 compared to 269 at this time last year and 250 at the end of October; New Listings in November were down 32% compared to October 2020, down 3% compared to November 2019 and down 2% compared to November 2018. Month’s supply of total residential listings is steady at 2 month’s supply (mostly seller’s market conditions) and sales to listings ratio of 86% compared to 69% in October 2020, 73% in November 2019 and 55% in November 2018. Year-over-year, the House Price Index is up 6.8%.
Ladner: Total Units Sold in November were 47 – down from 55 (15%) in October 2020, up from 42 (12%) in November 2019, up from 22 (114%) in November 2018; Active Listings are at 88 compared to 163 at this time last year and 120 at the end of October; New Listings in November were down 25% compared to October 2020, down 25% compared to November 2019 and down 14% compared to November 2018. Month’s supply of total residential listings is steady at 2 month’s supply (mostly seller’s market conditions) and sales to listings ratio of 124% compared to 108% in October 2020, 82% in November 2019 and 50% in November 2018. Year-over-year, the House Price Index is up 9.0%.
Tsawwassen: Total Units Sold in November were 55 – down from 76 (28%) in October 2020, up from 36 (53%) in November 2019, up from 17 (224%) in November 2018; Active Listings are at 248 compared to 250 at this time last year and 285 at the end of October; New Listings in November were down 9% compared to October 2020, up 75% compared to November 2019 and up 103% compared to November 2018. Month’s supply of total residential listings is up to 5 month’s supply (mostly seller’s market conditions with some areas of balanced conditions) and sales to listings ratio of 71% compared to 89% in October 2020, 82% in November 2019 and 45% in November 2018. Year-over-year, the House Price Index is up 8.9%.
Pitt Meadows: Total Units Sold in November were 46 – up from 39 (18%) in October 2020, up from 24 (92%) in November 2019, up from 23 (100%) in November 2018; Active Listings are at 64 compared to 82 at this time last year and 90 at the end of October; New Listings in November were down 24% compared to October 2020, up 100% compared to November 2019 and down 7% compared to November 2018. Month’s supply of total residential listings is down to 1 month’s supply (seller’s market conditions) and sales to listings ratio of 121% compared to 79% in October 2020, 126% in November 2019 and 56% in November 2018. Year-over-year, the House Price Index is up 7.3%.
Maple Ridge: Total Units Sold in November were 176 – down from 293 (40%) in October 2020, up from 169 (4%) in November 2019, up from 108 (63%) in November 2018; Active Listings are at 484 compared to 674 at this time last year and 527 at the end of October; New Listings in November were down 30% compared to October 2020, down 4% compared to November 2019 and up 1% compared to November 2018. Month’s supply of total residential listings is up to 3 month’s supply (mostly seller’s market conditions with some areas of balanced conditions) and sales to listings ratio of 86% compared to 101% in October 2020, 78% in November 2019 and 53% in November 2018. Year-over-year, the House Price Index is up 8.7%.
Comments:
Post Your Comment: